Hello Everyone,
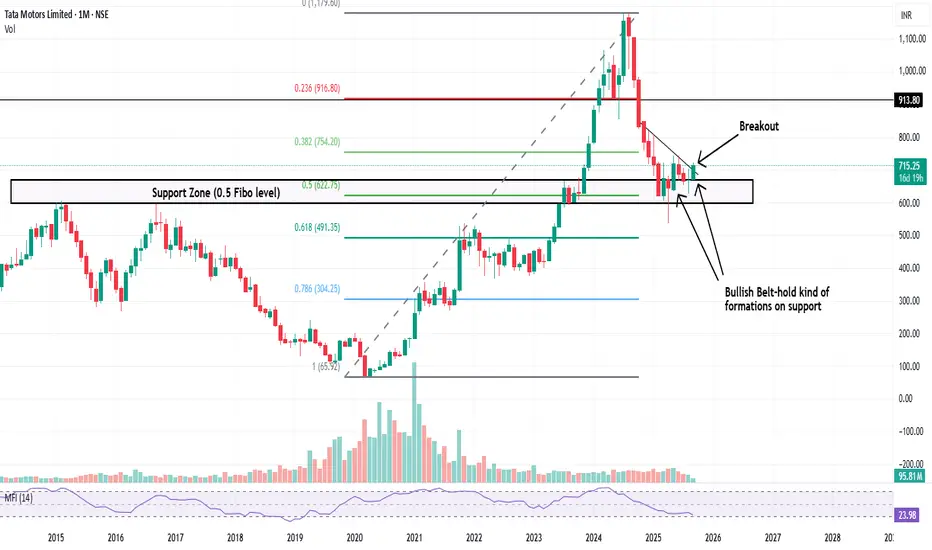
Here I have analysed the Tata Motors chart and it looks bullish for long term.
It has took Support on previous strong support.
And that zone is also 0.50 fibonacci level which is an healthly retracement considered in price action analysis.
Stock has also given breakout recently which looks good on 1W Timeframe.
So this stock looks good on 1M and 1W TF, hence this can be considered as bullish setup.
Disclaimer: This is just an a price action analysis of stock Tata Motors. Don't consider this as an stock tip or advice. Invest/Trade at your own risk.
Pubblicazioni correlate
Declinazione di responsabilità
Le informazioni ed i contenuti pubblicati non costituiscono in alcun modo una sollecitazione ad investire o ad operare nei mercati finanziari. Non sono inoltre fornite o supportate da TradingView. Maggiori dettagli nelle Condizioni d'uso.
Pubblicazioni correlate
Declinazione di responsabilità
Le informazioni ed i contenuti pubblicati non costituiscono in alcun modo una sollecitazione ad investire o ad operare nei mercati finanziari. Non sono inoltre fornite o supportate da TradingView. Maggiori dettagli nelle Condizioni d'uso.