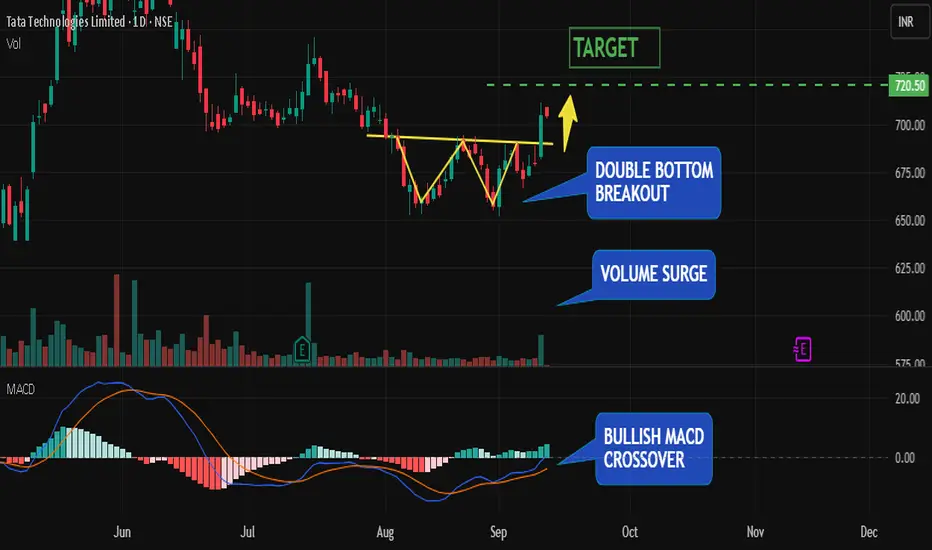
The stock has recently completed a double-bottom reversal pattern. A double bottom is one of the most reliable bullish reversal setups, often described as a “W-shaped” formation. It occurs when price tests the same support level twice, with sellers unable to push lower both times. This repeated defense by buyers signals demand at those levels and exhaustion of selling pressure.
Once price broke above the neckline (the midpoint of the “W”), the pattern was confirmed, suggesting that buyers are regaining control and an uptrend may be unfolding.
But what makes this breakout even stronger is the confluence of technical signals:
Bullish MACD Crossover: The MACD line has crossed above the signal line, shifting momentum to the upside. This indicates that bullish momentum is not only present but accelerating.
Volume Surge: Breakouts accompanied by rising volume are considered stronger and more reliable. In this case, the surge in volume confirms that institutions and larger players are participating in the move, adding credibility to the breakout.
Together, these signals create a powerful alignment of pattern, momentum, and participation.
Trade Plan:
Entry: On breakout above neckline or on a healthy retest of the neckline as support.
Target: ₹720, calculated as the measured move objective from the double bottom formation.
Risk Management: Always size positions carefully. Risking only 1–2% of capital per trade ensures you can survive a string of losses and stay in the game long-term.
Trade chiuso: obiettivo raggiunto
price has hit the target successfullyMy Social Media links :
📥 Instagram - instagram.com/sagar_trademaster/
📥 Youtube - youtube.com/@TruthfulTrader
📥 Instagram - instagram.com/sagar_trademaster/
📥 Youtube - youtube.com/@TruthfulTrader
Declinazione di responsabilità
Le informazioni ed i contenuti pubblicati non costituiscono in alcun modo una sollecitazione ad investire o ad operare nei mercati finanziari. Non sono inoltre fornite o supportate da TradingView. Maggiori dettagli nelle Condizioni d'uso.
My Social Media links :
📥 Instagram - instagram.com/sagar_trademaster/
📥 Youtube - youtube.com/@TruthfulTrader
📥 Instagram - instagram.com/sagar_trademaster/
📥 Youtube - youtube.com/@TruthfulTrader
Declinazione di responsabilità
Le informazioni ed i contenuti pubblicati non costituiscono in alcun modo una sollecitazione ad investire o ad operare nei mercati finanziari. Non sono inoltre fornite o supportate da TradingView. Maggiori dettagli nelle Condizioni d'uso.