#TECHMAHINDRA
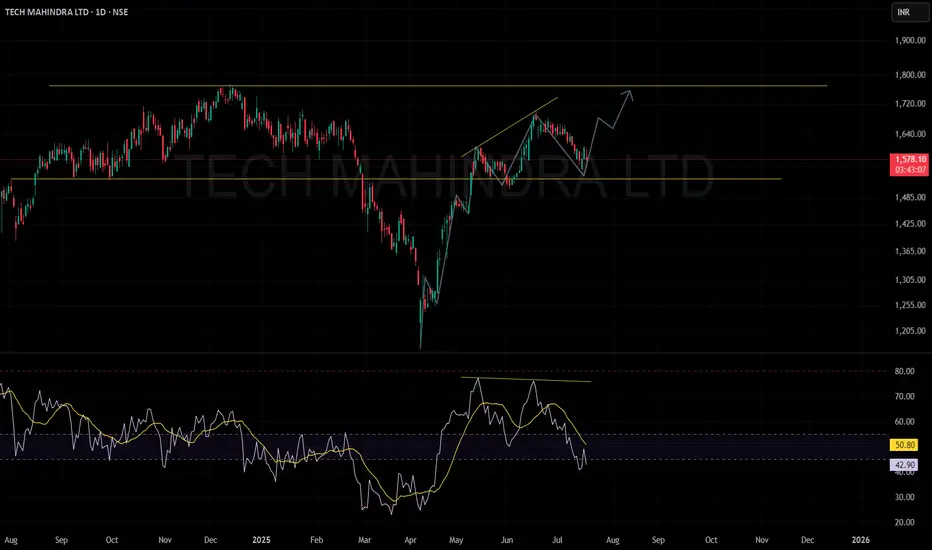
Support and Resistance:
A support zone is identified near ₹1,500 (lower yellow horizontal line).
The resistance zone is marked around ₹1,800 (indicated by the upper yellow horizontal line).
Trend Analysis:
Following a significant decline, the stock has shown a sharp recovery and is now consolidating.
A possible bullish scenario is depicted, anticipating a move towards the resistance zone, subject to price confirmation.
RSI (Relative Strength Index):
Currently, RSI is around 43.56, suggesting mild bearishness.
The RSI previously formed a bearish divergence (lower highs on RSI while price made higher highs), and has since declined.
The yellow moving average line on RSI indicates the momentum trend is still down.
Chart Pattern:
The recent pattern suggests that the stock has pulled back after a failed attempt to break higher, possibly setting up for another upward move.
Summary: Tech Mahindra is at an important technical juncture, consolidating after a recent decline. If it holds above support and momentum improves, a move towards ₹1,800 is possible; however, the current RSI weakness suggests caution until clear strength emerges.
Declinazione di responsabilità
Le informazioni ed i contenuti pubblicati non costituiscono in alcun modo una sollecitazione ad investire o ad operare nei mercati finanziari. Non sono inoltre fornite o supportate da TradingView. Maggiori dettagli nelle Condizioni d'uso.
Declinazione di responsabilità
Le informazioni ed i contenuti pubblicati non costituiscono in alcun modo una sollecitazione ad investire o ad operare nei mercati finanziari. Non sono inoltre fornite o supportate da TradingView. Maggiori dettagli nelle Condizioni d'uso.