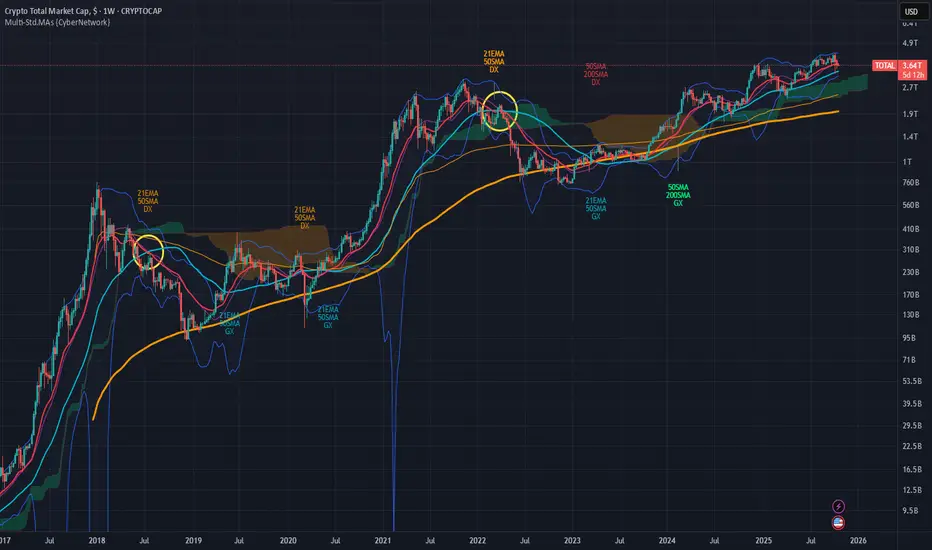
Bull market ends when the RED 21 EMA crosses below the green 50 SMA line on the weekly chart of the Crypto TOTAL Market Cap.
Buying BTC and ETH (and KAS as well after this cycle) aggressively only when price has returned to around the thick orange 200 SMA line, and especially whenever it falls below.
Buying BTC and ETH (and KAS as well after this cycle) aggressively only when price has returned to around the thick orange 200 SMA line, and especially whenever it falls below.
Nota
Current daily chart analysisPresently supported above the thin orange 200 VWMA line.
But bullish continuation possible only if it returns to above the green 50 SMA line.
Pubblicazioni correlate
Declinazione di responsabilità
Le informazioni ed i contenuti pubblicati non costituiscono in alcun modo una sollecitazione ad investire o ad operare nei mercati finanziari. Non sono inoltre fornite o supportate da TradingView. Maggiori dettagli nelle Condizioni d'uso.
Pubblicazioni correlate
Declinazione di responsabilità
Le informazioni ed i contenuti pubblicati non costituiscono in alcun modo una sollecitazione ad investire o ad operare nei mercati finanziari. Non sono inoltre fornite o supportate da TradingView. Maggiori dettagli nelle Condizioni d'uso.