⚡️
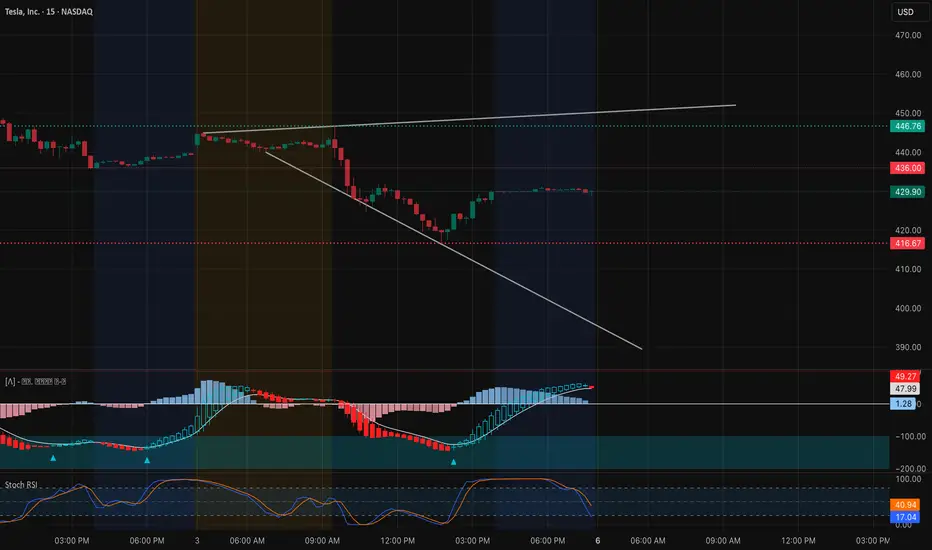
Market Context & Overview (15-Min Chart) TSLA has been under steady selling pressure, sliding from the $446–450 resistance zone toward the $416–420 support. The 15-minute chart reveals a clear short-term downtrend, marked by a descending trendline and a series of lower highs. However, buyers finally showed signs of life late Friday, creating a rebound attempt above $425 — a minor but notable shift in momentum.
The MACD histogram has turned positive, and the blue line has crossed over the red, suggesting early bullish momentum building up after a short-term exhaustion. The Stoch RSI has curled upward from oversold territory, hinting that the stock may be setting up for a relief bounce if the intraday trendline breaks cleanly above $432–$435.
GEX Confirmation (1H Chart Insight)

The 1-hour GEX (Gamma Exposure) chart adds an important institutional perspective. The highest positive NET GEX sits between $446–$452, aligning with the 2nd and 3rd CALL walls — a significant resistance area where dealer hedging can dampen upside movement unless a strong breakout occurs.
On the downside, heavy PUT walls and support zones rest around $416–$405, reinforcing this as the critical defense zone for bulls. If price holds above $416 early this week, a short-term reversal toward $440+ becomes highly probable as option dealers shift their delta hedging upward.
IVR remains moderate (26.7), with CALL positioning at 62.9%, suggesting sentiment still leans bullish, though not extreme.
Trade Scenarios (for This Week)
Bullish Case: If TSLA breaks and sustains above $435, expect momentum to accelerate toward $446, and possibly $452, where the next CALL wall sits.
* Entry: Above 435 confirmation
* Target 1: 446
* Target 2: 452
* Stop-Loss: Below 425
Bearish Case: If price fails to reclaim 435 and breaks back below $420, sellers could retest $416 and possibly sweep toward $405, which is the major PUT support level on GEX.
* Entry: Below 420
* Target 1: 416
* Target 2: 405
* Stop-Loss: Above 430
Options Insight Given the GEX structure, short-term calls near 430–440 could benefit from a quick bounce play if momentum continues early in the week. Conversely, puts near 420 become favorable only if TSLA fails to break the descending trendline. A balanced gamma landscape this week may create a “whipsaw” environment, so avoid chasing extremes — trade confirmation, not prediction.
My Thoughts: This setup feels like a “pressure build” zone — bears losing momentum but bulls not yet commanding control. A breakout from the descending trendline will likely dictate the week’s tone. The key is whether TSLA can convert $430–$435 into support. A sustained hold above that could quickly trigger gamma-driven buying back toward the mid-$440s.
If it rejects again and volume fades, the PUT side could reload, making $416 the final line before a larger flush. Watch that MACD and Stoch RSI cross — they’re early tells of rotation strength.
Disclaimer: This analysis is for educational purposes only and does not constitute financial advice. Always perform your own due diligence and manage risk responsibly before trading.
Market Context & Overview (15-Min Chart) TSLA has been under steady selling pressure, sliding from the $446–450 resistance zone toward the $416–420 support. The 15-minute chart reveals a clear short-term downtrend, marked by a descending trendline and a series of lower highs. However, buyers finally showed signs of life late Friday, creating a rebound attempt above $425 — a minor but notable shift in momentum.
The MACD histogram has turned positive, and the blue line has crossed over the red, suggesting early bullish momentum building up after a short-term exhaustion. The Stoch RSI has curled upward from oversold territory, hinting that the stock may be setting up for a relief bounce if the intraday trendline breaks cleanly above $432–$435.
GEX Confirmation (1H Chart Insight)
The 1-hour GEX (Gamma Exposure) chart adds an important institutional perspective. The highest positive NET GEX sits between $446–$452, aligning with the 2nd and 3rd CALL walls — a significant resistance area where dealer hedging can dampen upside movement unless a strong breakout occurs.
On the downside, heavy PUT walls and support zones rest around $416–$405, reinforcing this as the critical defense zone for bulls. If price holds above $416 early this week, a short-term reversal toward $440+ becomes highly probable as option dealers shift their delta hedging upward.
IVR remains moderate (26.7), with CALL positioning at 62.9%, suggesting sentiment still leans bullish, though not extreme.
Trade Scenarios (for This Week)
Bullish Case: If TSLA breaks and sustains above $435, expect momentum to accelerate toward $446, and possibly $452, where the next CALL wall sits.
* Entry: Above 435 confirmation
* Target 1: 446
* Target 2: 452
* Stop-Loss: Below 425
Bearish Case: If price fails to reclaim 435 and breaks back below $420, sellers could retest $416 and possibly sweep toward $405, which is the major PUT support level on GEX.
* Entry: Below 420
* Target 1: 416
* Target 2: 405
* Stop-Loss: Above 430
Options Insight Given the GEX structure, short-term calls near 430–440 could benefit from a quick bounce play if momentum continues early in the week. Conversely, puts near 420 become favorable only if TSLA fails to break the descending trendline. A balanced gamma landscape this week may create a “whipsaw” environment, so avoid chasing extremes — trade confirmation, not prediction.
My Thoughts: This setup feels like a “pressure build” zone — bears losing momentum but bulls not yet commanding control. A breakout from the descending trendline will likely dictate the week’s tone. The key is whether TSLA can convert $430–$435 into support. A sustained hold above that could quickly trigger gamma-driven buying back toward the mid-$440s.
If it rejects again and volume fades, the PUT side could reload, making $416 the final line before a larger flush. Watch that MACD and Stoch RSI cross — they’re early tells of rotation strength.
Disclaimer: This analysis is for educational purposes only and does not constitute financial advice. Always perform your own due diligence and manage risk responsibly before trading.
Declinazione di responsabilità
Le informazioni e le pubblicazioni non sono intese come, e non costituiscono, consulenza o raccomandazioni finanziarie, di investimento, di trading o di altro tipo fornite o approvate da TradingView. Per ulteriori informazioni, consultare i Termini di utilizzo.
Declinazione di responsabilità
Le informazioni e le pubblicazioni non sono intese come, e non costituiscono, consulenza o raccomandazioni finanziarie, di investimento, di trading o di altro tipo fornite o approvate da TradingView. Per ulteriori informazioni, consultare i Termini di utilizzo.