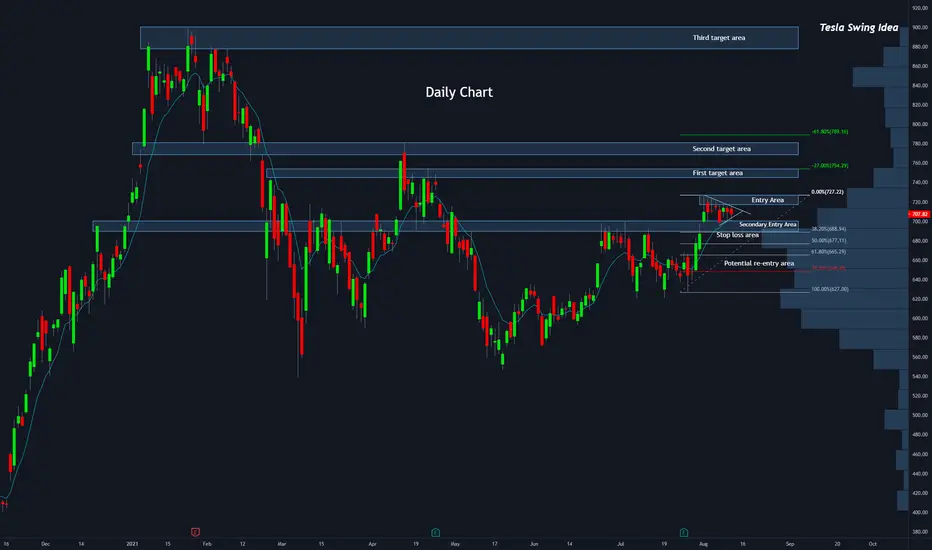
The Idea
Enter on the break of the symmetrical triangle at ~718-728. The exact entry should be determined using intra-day price action in these next few days.
Potential stop loss 1: Under ~700 (break of triangle and entry into demand zone)
Potential stop loss 2: Under ~690 (break of demand zone + break of 38.2% Fibonacci level)
Potential target 1: ~750 (supply zone + 27% Fibonacci level)
Potential target 2: ~780 (supply zone + 61.8% Fibonacci level)
Potential target 3: All time high +
Reasoning
1) Broke, retested and held critical zone (supported by both key price levels as well as VPVR).
2) Has began respecting the 9 EMA closely.
3) Created a Symmetrical Triangle formation indicating an explosive move is on the horizon.
Notes
- If the price breaks the triangle to the downside but the demand zone holds (creating a Bull Flag/Falling Wedge), I would personally still consider the play to be valid. In this scenario, I would either:
- If the price breaks down through the demand zone, I would exit and potentially re-enter at the 61.8% - 78.6% Fibonacci levels.
Here's the Symmetrical Triangle zoomed in on the 2 hour chart

Enter on the break of the symmetrical triangle at ~718-728. The exact entry should be determined using intra-day price action in these next few days.
Potential stop loss 1: Under ~700 (break of triangle and entry into demand zone)
Potential stop loss 2: Under ~690 (break of demand zone + break of 38.2% Fibonacci level)
Potential target 1: ~750 (supply zone + 27% Fibonacci level)
Potential target 2: ~780 (supply zone + 61.8% Fibonacci level)
Potential target 3: All time high +
Reasoning
1) Broke, retested and held critical zone (supported by both key price levels as well as VPVR).
2) Has began respecting the 9 EMA closely.
3) Created a Symmetrical Triangle formation indicating an explosive move is on the horizon.
Notes
- If the price breaks the triangle to the downside but the demand zone holds (creating a Bull Flag/Falling Wedge), I would personally still consider the play to be valid. In this scenario, I would either:
- Enter once the price enters the original planned entry area (better win % but lower R:R play).
- Enter at or in the demand zone ("Secondary Entry Area") once it shows confirmation that it still wants to hold (lower win % but higher R:R play).
- If the price breaks down through the demand zone, I would exit and potentially re-enter at the 61.8% - 78.6% Fibonacci levels.
Here's the Symmetrical Triangle zoomed in on the 2 hour chart
Declinazione di responsabilità
Le informazioni e le pubblicazioni non sono intese come, e non costituiscono, consulenza o raccomandazioni finanziarie, di investimento, di trading o di altro tipo fornite o approvate da TradingView. Per ulteriori informazioni, consultare i Termini di utilizzo.
Declinazione di responsabilità
Le informazioni e le pubblicazioni non sono intese come, e non costituiscono, consulenza o raccomandazioni finanziarie, di investimento, di trading o di altro tipo fornite o approvate da TradingView. Per ulteriori informazioni, consultare i Termini di utilizzo.