Hi!
Trend Analysis:
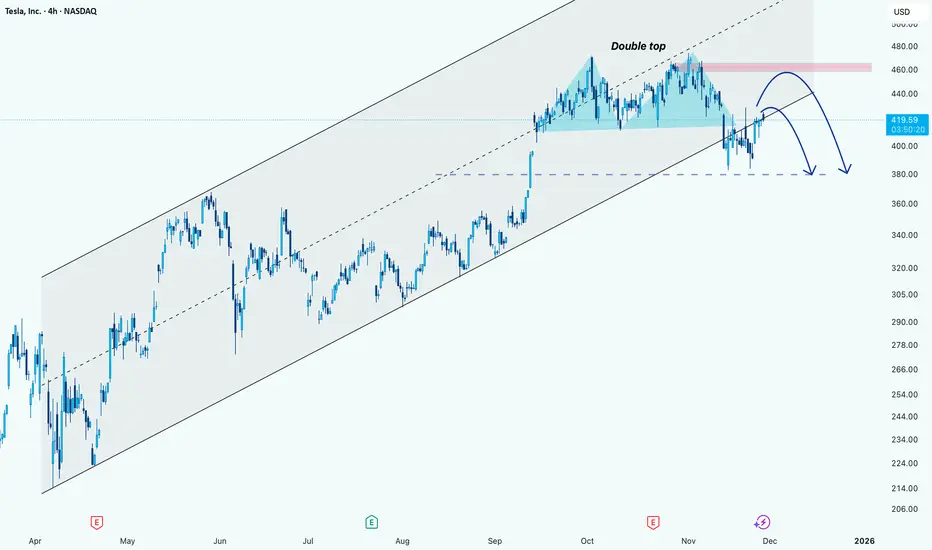
TSLA has been trading in an ascending channel for several months, with higher highs and higher lows visible since April.
The recent price action broke above the midline of the channel but is currently consolidating near the $420-$425 area.
Pattern Formation:
A Double Top pattern near the $460 level formed.
This pattern signals a potential reversal if the price fails to break above the resistance zone (marked in pink).
The neckline of this double top appears around $400, which is also a key support zone.
Potential Price Action:
TSLA could retest the resistance zone near $455-$460.
If it fails to break this area convincingly, the double top pattern could trigger a reversal.
If the reversal occurs at the resistance zone, price may fall toward the neckline/support area near $380.
This aligns with the lower boundary of the channel and previous support levels.
Trend Analysis:
TSLA has been trading in an ascending channel for several months, with higher highs and higher lows visible since April.
The recent price action broke above the midline of the channel but is currently consolidating near the $420-$425 area.
Pattern Formation:
A Double Top pattern near the $460 level formed.
This pattern signals a potential reversal if the price fails to break above the resistance zone (marked in pink).
The neckline of this double top appears around $400, which is also a key support zone.
Potential Price Action:
TSLA could retest the resistance zone near $455-$460.
If it fails to break this area convincingly, the double top pattern could trigger a reversal.
If the reversal occurs at the resistance zone, price may fall toward the neckline/support area near $380.
This aligns with the lower boundary of the channel and previous support levels.
Proud ThinkMarkets Ambassador -> Discover & Grow: bit.ly/Think-Markets
------
My recommended Exchange -> YEX: bit.ly/YEX-M
------
Telegram channel: t.me/melikatrader94
Forex channel: t.me/melikatrader94GoldForex
------
My recommended Exchange -> YEX: bit.ly/YEX-M
------
Telegram channel: t.me/melikatrader94
Forex channel: t.me/melikatrader94GoldForex
Pubblicazioni correlate
Declinazione di responsabilità
Le informazioni e le pubblicazioni non sono intese come, e non costituiscono, consulenza o raccomandazioni finanziarie, di investimento, di trading o di altro tipo fornite o approvate da TradingView. Per ulteriori informazioni, consultare i Termini di utilizzo.