Here’s the full multi-timeframe outlook for TSLA based on SMC structure, channels, BOS/CHoCH shifts, momentum, and the GEX map. Each section is separated so you can attach the matching chart under it.
1. Weekly Timeframe (1W)
Macro Structure
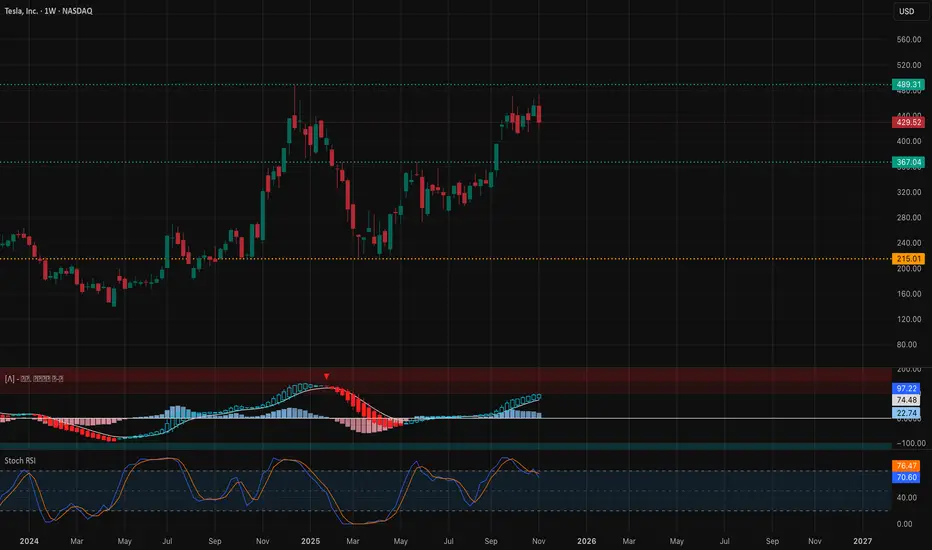
TSLA is still holding its bigger weekly breakout after clearing the long-term descending trendline. The pullback off 480 looks like a standard retest rather than a reversal.
Weekly demand at 368–402 hasn’t been touched, so the broader trend still favors the upside as long as price stays above that region. Weekly MACD momentum continues to rise while Stoch RSI cools off, signaling consolidation rather than weakness.
Weekly Trade View As long as TSLA stays above 402, the weekly bias remains bullish with potential to retest 486 once shorter timeframes settle.
Weekly GEX View Large positive GEX above 470–480 slows upside momentum. Large negative GEX under 420 accelerates downside moves. TSLA currently sits between these zones, so whichever side breaks gets momentum.
2. Daily Timeframe (1D)

Daily Trend
The daily chart just printed a downside CHoCH inside the ascending channel. That confirms short-term weakness even though the weekly remains bullish.
The key line is 411–415. Losing this level flips the daily fully bearish. Holding it keeps the pullback healthy.
Daily MACD is red and still heading down. Stoch RSI is oversold but hasn’t curled up yet, meaning momentum hasn’t turned.
Daily Trade View Hold 411 → potential bounce into 438 then 455. Break 411 → opens a move toward 392–368.
Daily GEX View Multiple put walls at 421–425 and 400. These usually act as magnets during pullbacks because of dealer hedging.
3. 1-Hour Timeframe (1H)

Short-Term Structure
TSLA remains in a descending channel on the 1H. The most recent BOS was bearish, and the CHoCH didn’t reclaim any major highs.
The short-term pivot is 439. If TSLA stays under that line, momentum stays bearish.
MACD is flattening and Stoch RSI is trying to curl, hinting at a potential early-week bounce.
1H Trade View Below 439 → bearish continuation. Above 439 → opens a move into 447–455.
If TSLA can’t reclaim 432–439 early, expect another test toward 425–421.
4. 15-Minute Timeframe (15M)

Intraday Structure
The 15M shows a clean descending channel. Bulls attempted a small CHoCH, but without an upside BOS, momentum is still controlled by sellers.
The main intraday battle is 432–438. Break above → intraday reversal. Reject → continuation lower.
MACD is trying to turn but hasn’t built momentum yet.
15M Trade View Break above 437–438 → scalp long toward 445. Reject 432–434 → scalp short toward 425 and 421.
5. GEX Map & Options Strategy

GEX Interpretation for the Week
Positive GEX sits above 455–480 Negative GEX increases under 425 Major put wall at 421.88 Call walls thin around 445–465
What that means: Upside above 455 slows down Downside below 430 sharpens 421 is a strong gravitational level A clean break below 421 increases volatility rapidly
Options Strategy
If TSLA fails to reclaim 438: Short-dated puts targeting 421 make sense.
If TSLA reclaims 439 and holds: Short-dated calls into 445–455 are reasonable.
Avoid deep OTM calls above 470 because price tends to stall in strong positive GEX zones.
My Thought
TSLA is sitting at a major inflection point. The weekly chart still leans bullish, but the daily and intraday structure are showing short-term weakness. This entire week will revolve around how price reacts around 438.
Rejecting 438 favors continuation into 425 and 421. Reclaiming 438 puts 447–455 back into play.
Keep the levels simple. Let 438 decide the direction for the week.
Disclaimer
This analysis is for educational purposes only and not financial advice. Always trade your own plan and manage your risk. If you want a breakdown for another ticker, just let me know.
1. Weekly Timeframe (1W)
Macro Structure
TSLA is still holding its bigger weekly breakout after clearing the long-term descending trendline. The pullback off 480 looks like a standard retest rather than a reversal.
Weekly demand at 368–402 hasn’t been touched, so the broader trend still favors the upside as long as price stays above that region. Weekly MACD momentum continues to rise while Stoch RSI cools off, signaling consolidation rather than weakness.
Weekly Trade View As long as TSLA stays above 402, the weekly bias remains bullish with potential to retest 486 once shorter timeframes settle.
Weekly GEX View Large positive GEX above 470–480 slows upside momentum. Large negative GEX under 420 accelerates downside moves. TSLA currently sits between these zones, so whichever side breaks gets momentum.
2. Daily Timeframe (1D)
Daily Trend
The daily chart just printed a downside CHoCH inside the ascending channel. That confirms short-term weakness even though the weekly remains bullish.
The key line is 411–415. Losing this level flips the daily fully bearish. Holding it keeps the pullback healthy.
Daily MACD is red and still heading down. Stoch RSI is oversold but hasn’t curled up yet, meaning momentum hasn’t turned.
Daily Trade View Hold 411 → potential bounce into 438 then 455. Break 411 → opens a move toward 392–368.
Daily GEX View Multiple put walls at 421–425 and 400. These usually act as magnets during pullbacks because of dealer hedging.
3. 1-Hour Timeframe (1H)
Short-Term Structure
TSLA remains in a descending channel on the 1H. The most recent BOS was bearish, and the CHoCH didn’t reclaim any major highs.
The short-term pivot is 439. If TSLA stays under that line, momentum stays bearish.
MACD is flattening and Stoch RSI is trying to curl, hinting at a potential early-week bounce.
1H Trade View Below 439 → bearish continuation. Above 439 → opens a move into 447–455.
If TSLA can’t reclaim 432–439 early, expect another test toward 425–421.
4. 15-Minute Timeframe (15M)
Intraday Structure
The 15M shows a clean descending channel. Bulls attempted a small CHoCH, but without an upside BOS, momentum is still controlled by sellers.
The main intraday battle is 432–438. Break above → intraday reversal. Reject → continuation lower.
MACD is trying to turn but hasn’t built momentum yet.
15M Trade View Break above 437–438 → scalp long toward 445. Reject 432–434 → scalp short toward 425 and 421.
5. GEX Map & Options Strategy
GEX Interpretation for the Week
Positive GEX sits above 455–480 Negative GEX increases under 425 Major put wall at 421.88 Call walls thin around 445–465
What that means: Upside above 455 slows down Downside below 430 sharpens 421 is a strong gravitational level A clean break below 421 increases volatility rapidly
Options Strategy
If TSLA fails to reclaim 438: Short-dated puts targeting 421 make sense.
If TSLA reclaims 439 and holds: Short-dated calls into 445–455 are reasonable.
Avoid deep OTM calls above 470 because price tends to stall in strong positive GEX zones.
My Thought
TSLA is sitting at a major inflection point. The weekly chart still leans bullish, but the daily and intraday structure are showing short-term weakness. This entire week will revolve around how price reacts around 438.
Rejecting 438 favors continuation into 425 and 421. Reclaiming 438 puts 447–455 back into play.
Keep the levels simple. Let 438 decide the direction for the week.
Disclaimer
This analysis is for educational purposes only and not financial advice. Always trade your own plan and manage your risk. If you want a breakdown for another ticker, just let me know.
Declinazione di responsabilità
Le informazioni e le pubblicazioni non sono intese come, e non costituiscono, consulenza o raccomandazioni finanziarie, di investimento, di trading o di altro tipo fornite o approvate da TradingView. Per ulteriori informazioni, consultare i Termini di utilizzo.
Declinazione di responsabilità
Le informazioni e le pubblicazioni non sono intese come, e non costituiscono, consulenza o raccomandazioni finanziarie, di investimento, di trading o di altro tipo fornite o approvate da TradingView. Per ulteriori informazioni, consultare i Termini di utilizzo.