Market Preview
* Macro backdrop: U.S. index futures are steady after a strong tech rally last week. Rates and the dollar remain stable, leaving room for growth stocks to extend gains.
* Sector tone: EV and AI-related momentum is strong, with Tesla leading on heavy volume and institutional call buying.
Technical Analysis – TSLA
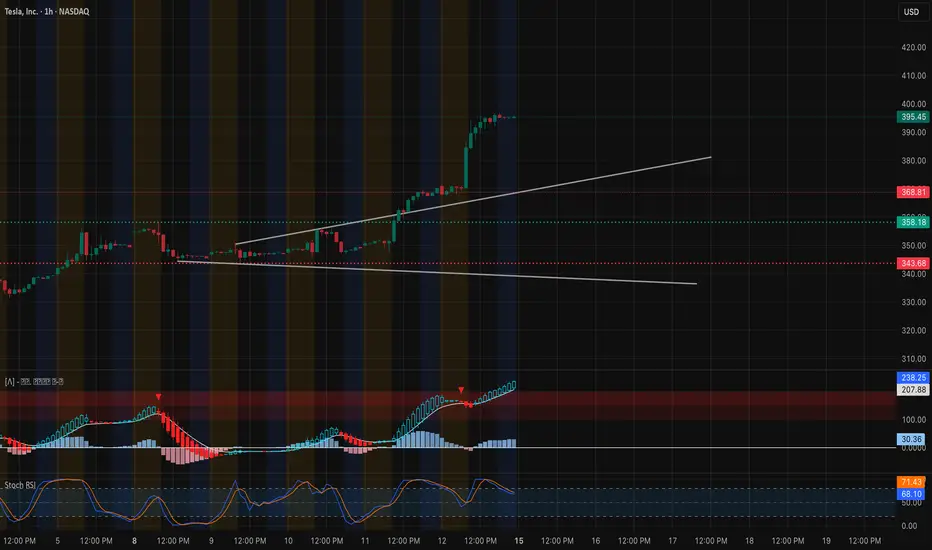
Trend & Structure (1-Hour Chart)
* Price surged to $395–396 and is consolidating near the highs.
* Structure remains firmly bullish with higher highs/lows and a well-defined rising channel.
Key Levels
* Resistance: $396.6 (highest positive NETGEX / CALL Resistance), $405, and $420 as next upside targets.
* Support: $389.9 (near-term pivot), $368.8 (major breakout base), $347.5 (HVL zone).
Momentum & Indicators
* MACD on 1H is bullish and expanding, supporting continuation.
* Stoch RSI is near overbought, signaling possible brief consolidation or a minor pullback before another leg higher.
* Volume remains strong, showing solid institutional demand.
Options/GEX Insight

* Massive call positioning (≈98% call bias) with positive GEX layers up to $420 suggests market makers may support higher prices.
* IVR 17.4 and IVx avg 61.5 indicate elevated but manageable volatility.
Trade Scenarios for Sept 15
* Bullish Plan:
* Entry: Break/hold above $396.6 with volume.
* Targets: $405 → $420.
* Stop: Below $389.9.
* Defensive Plan (if rejection occurs):
* Entry: Loss of $389.9 with momentum shift.
* Targets: $368.8 → $347.5.
* Stop: Above $396.6.
Summary
Tesla heads into Monday with a strong bullish setup. Holding above $389.9 keeps momentum intact, while a breakout over $396.6 could trigger a run toward $405–420.
Disclaimer: This analysis is for educational purposes only and does not constitute financial advice. Always do your own research and manage risk before trading.
* Macro backdrop: U.S. index futures are steady after a strong tech rally last week. Rates and the dollar remain stable, leaving room for growth stocks to extend gains.
* Sector tone: EV and AI-related momentum is strong, with Tesla leading on heavy volume and institutional call buying.
Technical Analysis – TSLA
Trend & Structure (1-Hour Chart)
* Price surged to $395–396 and is consolidating near the highs.
* Structure remains firmly bullish with higher highs/lows and a well-defined rising channel.
Key Levels
* Resistance: $396.6 (highest positive NETGEX / CALL Resistance), $405, and $420 as next upside targets.
* Support: $389.9 (near-term pivot), $368.8 (major breakout base), $347.5 (HVL zone).
Momentum & Indicators
* MACD on 1H is bullish and expanding, supporting continuation.
* Stoch RSI is near overbought, signaling possible brief consolidation or a minor pullback before another leg higher.
* Volume remains strong, showing solid institutional demand.
Options/GEX Insight
* Massive call positioning (≈98% call bias) with positive GEX layers up to $420 suggests market makers may support higher prices.
* IVR 17.4 and IVx avg 61.5 indicate elevated but manageable volatility.
Trade Scenarios for Sept 15
* Bullish Plan:
* Entry: Break/hold above $396.6 with volume.
* Targets: $405 → $420.
* Stop: Below $389.9.
* Defensive Plan (if rejection occurs):
* Entry: Loss of $389.9 with momentum shift.
* Targets: $368.8 → $347.5.
* Stop: Above $396.6.
Summary
Tesla heads into Monday with a strong bullish setup. Holding above $389.9 keeps momentum intact, while a breakout over $396.6 could trigger a run toward $405–420.
Disclaimer: This analysis is for educational purposes only and does not constitute financial advice. Always do your own research and manage risk before trading.
Declinazione di responsabilità
Le informazioni e le pubblicazioni non sono intese come, e non costituiscono, consulenza o raccomandazioni finanziarie, di investimento, di trading o di altro tipo fornite o approvate da TradingView. Per ulteriori informazioni, consultare i Termini di utilizzo.
Declinazione di responsabilità
Le informazioni e le pubblicazioni non sono intese come, e non costituiscono, consulenza o raccomandazioni finanziarie, di investimento, di trading o di altro tipo fornite o approvate da TradingView. Per ulteriori informazioni, consultare i Termini di utilizzo.