📊 التحليل الفني لسهم UPS (NYSE:UPS) — فاصل شهري
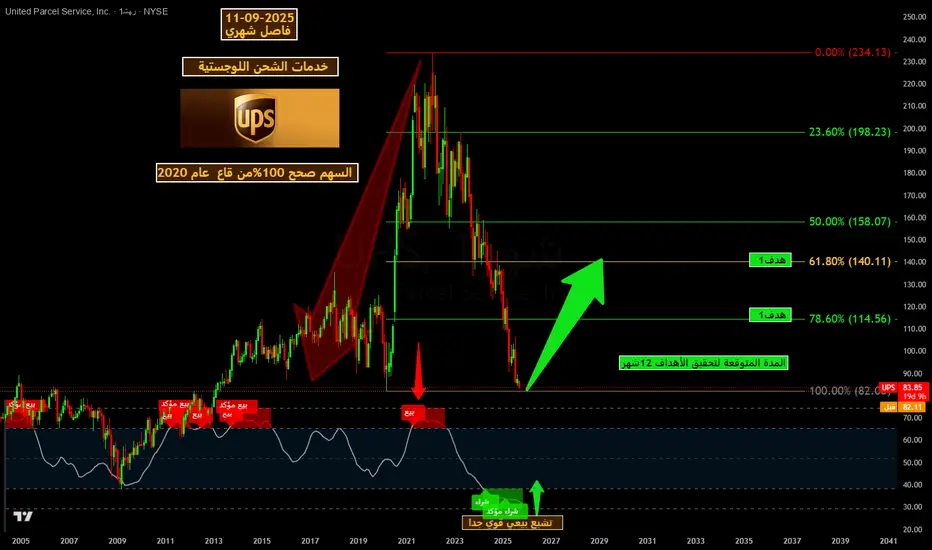
السهم صحح بنسبة 100% من موجة الصعود التي بدأت من قاع عام 2020.
حاليًا يتداول عند مستويات دعم قوية جدًا قرب 82 – 85 دولار.
مؤشر الزخم (المرفق أسفل الرسم) يُظهر حالة تشبع بيع قوية جدًا لم نشهدها منذ سنوات، مما يزيد من احتمالية الارتداد.
على المدى الزمني القادم (12 شهر متوقعة):
الهدف الأول: مستوى فيبوناتشي 61.8% عند 140 دولار تقريبًا.
الهدف الثاني: مستوى فيبوناتشي 78.6% عند 114 دولار.
استمرار الإغلاق الشهري أعلى من 82 دولار سيعزز من سيناريو الارتداد الصاعد.
⚠️ ملاحظة: هذا التحليل تعليمي وليس توصية استثمارية، القرار مسؤوليتك وحدك.
📊 Technical Analysis for UPS (NYSE:UPS) — Monthly Chart
The stock has fully corrected 100% of the bullish wave that started from the 2020 bottom.
Currently trading near a major support zone around 82 – 85 USD.
Momentum indicators are showing a very strong oversold condition, not seen in years, which increases the probability of a rebound.
Over the next 12 months, potential upside targets are:
🎯 Target 1: Fibonacci 61.8% retracement at ~140 USD
🎯 Target 2: Fibonacci 78.6% retracement at ~115 USD
A sustained monthly close above 82 USD will strengthen the bullish reversal scenario.
⚠️ Note: This analysis is for educational purposes only and does not constitute investment advice.
10TIMES
Declinazione di responsabilità
Le informazioni e le pubblicazioni non sono intese come, e non costituiscono, consulenza o raccomandazioni finanziarie, di investimento, di trading o di altro tipo fornite o approvate da TradingView. Per ulteriori informazioni, consultare i Termini di utilizzo.