US100 Price Action Insight
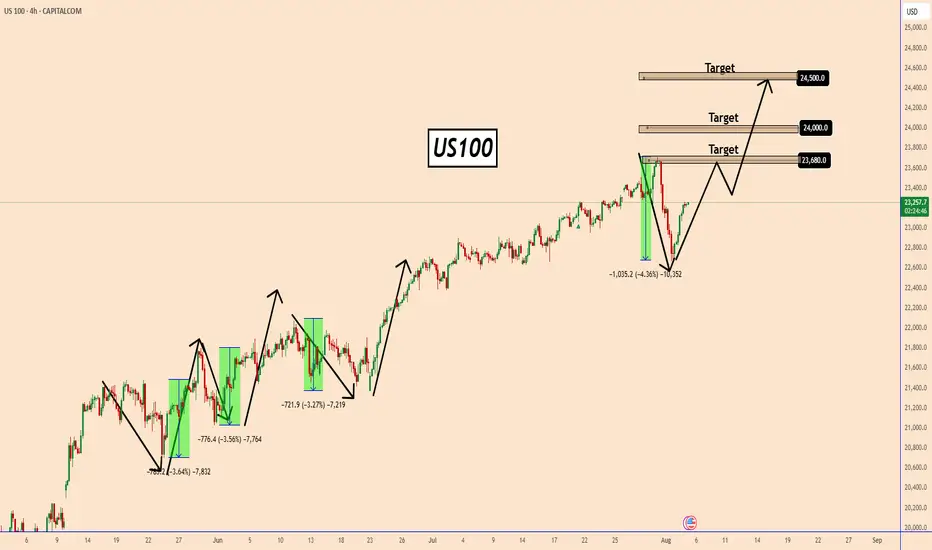
In recent analysis, we’ve seen the US100 drop multiple times last month by around 3.5% to 4%, but each time it quickly bounced back, showing that these moves were simply buying opportunities during deep pullbacks.
This time, the index fell by about 4.3% due to fears over new tariffs on August 1st, but it's already recovering, which suggests that the bullish trend remains intact.
If momentum continues, US100 could retest the highs near 23,680, and potentially break above to 24,000 or even 24,500.
You may find more details in the chart!
Thank you and Good Luck!
PS: Please support with a like or comment if you find this analysis useful for your trading day
✅MY FREE Signals Channel
t.me/TradingPuzzles
✅Personal Telegram
t.me/KlejdiCuni
✅Suggested News Channel
t.me/ForexNewsNavigator_Official
t.me/TradingPuzzles
✅Personal Telegram
t.me/KlejdiCuni
✅Suggested News Channel
t.me/ForexNewsNavigator_Official
Declinazione di responsabilità
Le informazioni e le pubblicazioni non sono intese come, e non costituiscono, consulenza o raccomandazioni finanziarie, di investimento, di trading o di altro tipo fornite o approvate da TradingView. Per ulteriori informazioni, consultare i Termini di utilizzo.