Current Price: 1.37706
Timeframe: 4 Hours
Technical Indicators Overview
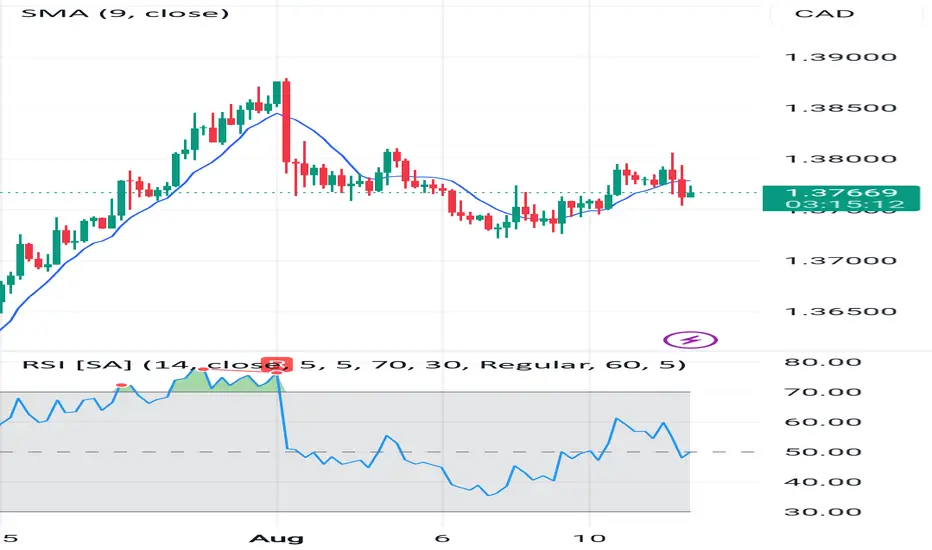
SMA (9-period): Price is hovering around the short-term moving average, signaling indecision in momentum.
RSI (14): Currently near the 50 level, showing a neutral momentum—neither overbought nor oversold.
Key Resistance: 1.3800 – A psychological and technical barrier tested multiple times.
Key Support: 1.3700 – A level where buyers previously stepped in to prevent further decline.
Price Action Summary
USDCAD recently saw a strong bullish move towards the 1.3900 area but quickly reversed, pulling back below the 1.3800 mark. Since then, price action has been choppy, suggesting a tug-of-war between buyers and sellers.
On the 4H chart, the SMA 9 is acting as a dynamic pivot, with candles frequently crossing above and below it. This behavior often precedes a breakout, but direction confirmation is still lacking.
RSI Insights
The RSI remains neutral, around 50, indicating a balance between buying and selling pressures. A move above 60 could invite bullish momentum, while a drop below 40 may trigger further selling.
Potential Scenarios
Bullish Breakout:
If price breaks and closes above 1.3800, the next upside target could be 1.3850–1.3900, where previous highs lie.
Bearish Reversal:
Failure to hold above 1.3750 could open the door for a move towards 1.3700, and below that, 1.3650.
Conclusion
USDCAD is in a consolidation phase, awaiting a catalyst for a decisive breakout. Traders should watch the 1.3800 resistance and 1.3750 support for clues on the next directional move.
Timeframe: 4 Hours
Technical Indicators Overview
SMA (9-period): Price is hovering around the short-term moving average, signaling indecision in momentum.
RSI (14): Currently near the 50 level, showing a neutral momentum—neither overbought nor oversold.
Key Resistance: 1.3800 – A psychological and technical barrier tested multiple times.
Key Support: 1.3700 – A level where buyers previously stepped in to prevent further decline.
Price Action Summary
USDCAD recently saw a strong bullish move towards the 1.3900 area but quickly reversed, pulling back below the 1.3800 mark. Since then, price action has been choppy, suggesting a tug-of-war between buyers and sellers.
On the 4H chart, the SMA 9 is acting as a dynamic pivot, with candles frequently crossing above and below it. This behavior often precedes a breakout, but direction confirmation is still lacking.
RSI Insights
The RSI remains neutral, around 50, indicating a balance between buying and selling pressures. A move above 60 could invite bullish momentum, while a drop below 40 may trigger further selling.
Potential Scenarios
Bullish Breakout:
If price breaks and closes above 1.3800, the next upside target could be 1.3850–1.3900, where previous highs lie.
Bearish Reversal:
Failure to hold above 1.3750 could open the door for a move towards 1.3700, and below that, 1.3650.
Conclusion
USDCAD is in a consolidation phase, awaiting a catalyst for a decisive breakout. Traders should watch the 1.3800 resistance and 1.3750 support for clues on the next directional move.
Declinazione di responsabilità
Le informazioni ed i contenuti pubblicati non costituiscono in alcun modo una sollecitazione ad investire o ad operare nei mercati finanziari. Non sono inoltre fornite o supportate da TradingView. Maggiori dettagli nelle Condizioni d'uso.
Declinazione di responsabilità
Le informazioni ed i contenuti pubblicati non costituiscono in alcun modo una sollecitazione ad investire o ad operare nei mercati finanziari. Non sono inoltre fornite o supportate da TradingView. Maggiori dettagli nelle Condizioni d'uso.