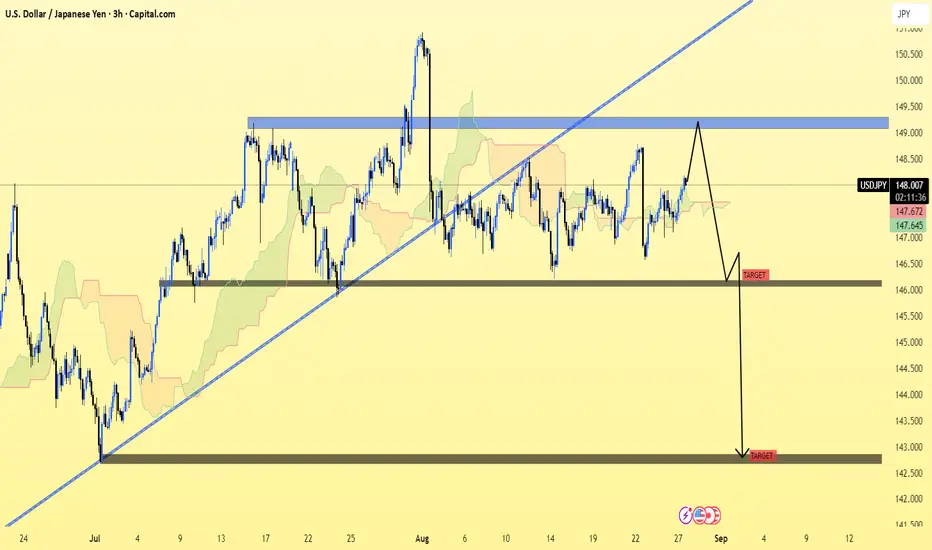
analyzing USD/JPY on the 3H chart.
Looking at my chart:
Price is trading around 148.05.
There’s a blue resistance zone near 149.00–149.50 (supply area).
You have drawn two downside targets after potential rejection.
📉 Key Bearish Targets (from your chart)
1. First Target Zone: Around 146.50
→ This is the first strong support area marked.
2. Second / Final Target Zone: Around 142.00–142.20
→ If bearish continuation plays out, this is the larger downside target.
⚠ Trade Notes
A rejection from 149.00 resistance could trigger a fall toward 146.50.
A break below 146.50 support would strengthen bearish momentum, opening the way to 142.00.
On the other hand, if price breaks and holds above 149.50, this bearish scenario is invalidated.
👉 In summary: Target 1 = 146.50, Target 2 = 142.00.
Trade attivo
trade activePubblicazioni correlate
Declinazione di responsabilità
Le informazioni ed i contenuti pubblicati non costituiscono in alcun modo una sollecitazione ad investire o ad operare nei mercati finanziari. Non sono inoltre fornite o supportate da TradingView. Maggiori dettagli nelle Condizioni d'uso.
Pubblicazioni correlate
Declinazione di responsabilità
Le informazioni ed i contenuti pubblicati non costituiscono in alcun modo una sollecitazione ad investire o ad operare nei mercati finanziari. Non sono inoltre fornite o supportate da TradingView. Maggiori dettagli nelle Condizioni d'uso.