USD/JPY (2H timeframe, FXCM) chart:
Here’s the setup my drawn — and what it suggests:
---
🧭 Chart Summary
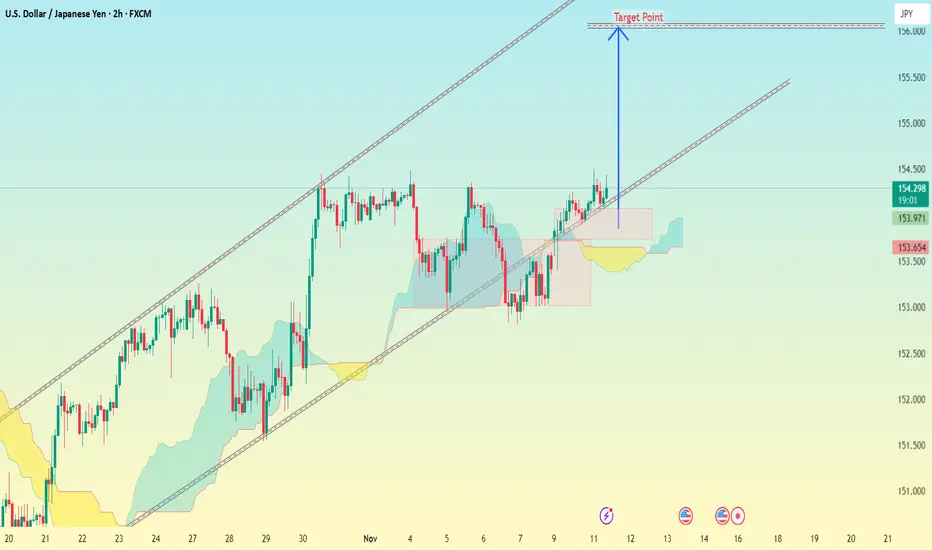
Current Price: Around 154.31
Trend: Uptrend channel (price moving between two parallel rising lines)
Breakout: Price has bounced above the midline and seems to be heading toward the upper boundary
Ichimoku Cloud: Price is above the cloud → confirming bullish momentum
Box (pink): Indicates previous consolidation or retest zone around 153.6–153.9
---
🎯 Target Analysis
From my chart, the blue arrow labeled "Target Point" points toward the upper trendline of the channel.
Target Zone: Around 155.80 – 156.00
(that’s where my upper channel resistance + target point line meet)
---
📈 Summary
Level Type Target Zone
Entry (current) — 154.3
1st Target Main upward target 155.8 – 156.0
Stop-loss (recommended) Below last swing / cloud 153.5 – 153.6
---
⚠ Notes:
As long as price stays above 153.8, bullish continuation looks strong.
If price breaks below 153.5, this bullish setup becomes weak and might turn sideways or bearish.
I can trail stop-loss once price crosses 155.0.
Here’s the setup my drawn — and what it suggests:
---
🧭 Chart Summary
Current Price: Around 154.31
Trend: Uptrend channel (price moving between two parallel rising lines)
Breakout: Price has bounced above the midline and seems to be heading toward the upper boundary
Ichimoku Cloud: Price is above the cloud → confirming bullish momentum
Box (pink): Indicates previous consolidation or retest zone around 153.6–153.9
---
🎯 Target Analysis
From my chart, the blue arrow labeled "Target Point" points toward the upper trendline of the channel.
Target Zone: Around 155.80 – 156.00
(that’s where my upper channel resistance + target point line meet)
---
📈 Summary
Level Type Target Zone
Entry (current) — 154.3
1st Target Main upward target 155.8 – 156.0
Stop-loss (recommended) Below last swing / cloud 153.5 – 153.6
---
⚠ Notes:
As long as price stays above 153.8, bullish continuation looks strong.
If price breaks below 153.5, this bullish setup becomes weak and might turn sideways or bearish.
I can trail stop-loss once price crosses 155.0.
Trade attivo
trade active 📲 Join telegram channel free .
t.me/addlist/dg3uSwzkMSplNjFk
Forex, Gold & Crypto Signals with detailed analysis & get consistent results.
t.me/addlist/dg3uSwzkMSplNjFk
Gold Signal's with proper TP & SL for high profit opportunities.
t.me/addlist/dg3uSwzkMSplNjFk
Forex, Gold & Crypto Signals with detailed analysis & get consistent results.
t.me/addlist/dg3uSwzkMSplNjFk
Gold Signal's with proper TP & SL for high profit opportunities.
Pubblicazioni correlate
Declinazione di responsabilità
Le informazioni e le pubblicazioni non sono intese come, e non costituiscono, consulenza o raccomandazioni finanziarie, di investimento, di trading o di altro tipo fornite o approvate da TradingView. Per ulteriori informazioni, consultare i Termini di utilizzo.
📲 Join telegram channel free .
t.me/addlist/dg3uSwzkMSplNjFk
Forex, Gold & Crypto Signals with detailed analysis & get consistent results.
t.me/addlist/dg3uSwzkMSplNjFk
Gold Signal's with proper TP & SL for high profit opportunities.
t.me/addlist/dg3uSwzkMSplNjFk
Forex, Gold & Crypto Signals with detailed analysis & get consistent results.
t.me/addlist/dg3uSwzkMSplNjFk
Gold Signal's with proper TP & SL for high profit opportunities.
Pubblicazioni correlate
Declinazione di responsabilità
Le informazioni e le pubblicazioni non sono intese come, e non costituiscono, consulenza o raccomandazioni finanziarie, di investimento, di trading o di altro tipo fornite o approvate da TradingView. Per ulteriori informazioni, consultare i Termini di utilizzo.