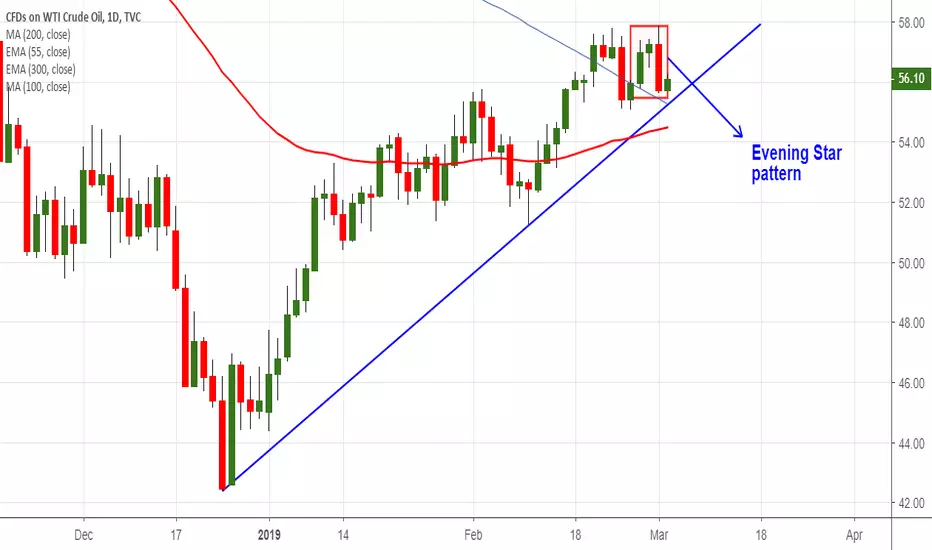
Candlestick Pattern- Evening star
Major resistance- $58
US oil has declined sharply after showing a good jump till $57.85. The previous high was around $57.79 made on Feb 22nd 2019 and on Friday oil jumped slightly above $57.79 started to show huge sell-off. It hits low of $55.60 and is currently trading around $56.04.
On the lower side, near term major support is around $55 and any violation below will drag the commodity till$54.41/$53.77 (61.8% fib)/$53.13.
The near term resistance is around $56.43 and any break above targets $57/$57.85. Any break above $58 confirms major trend reversal.
It is good to sell on rallies around $56.45-50 with SL around $57.05 for the TP of $55/$54.41.
Declinazione di responsabilità
Le informazioni e le pubblicazioni non sono intese come, e non costituiscono, consulenza o raccomandazioni finanziarie, di investimento, di trading o di altro tipo fornite o approvate da TradingView. Per ulteriori informazioni, consultare i Termini di utilizzo.
Declinazione di responsabilità
Le informazioni e le pubblicazioni non sono intese come, e non costituiscono, consulenza o raccomandazioni finanziarie, di investimento, di trading o di altro tipo fornite o approvate da TradingView. Per ulteriori informazioni, consultare i Termini di utilizzo.