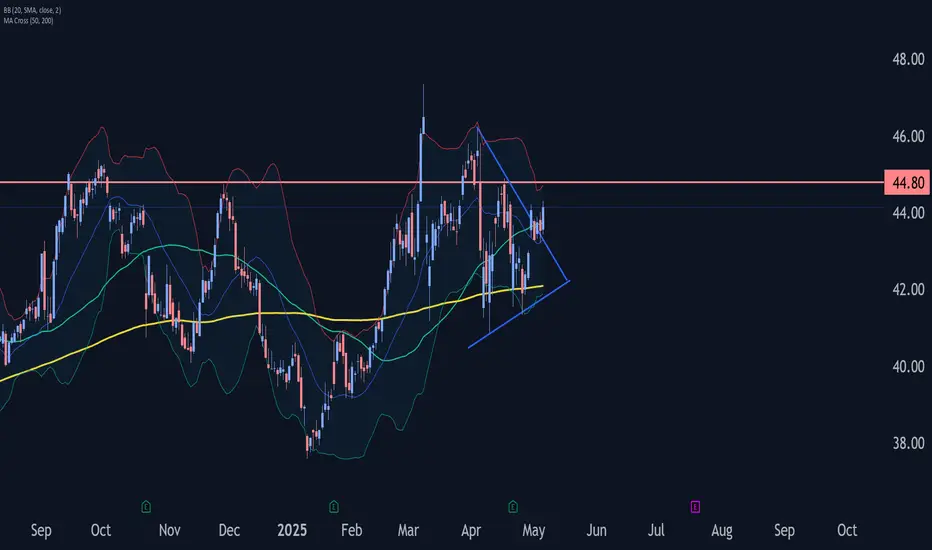
- Verizon broke daily Triangle
- Likely to rise to resistance level 44.80
Verizon recently broke the resistance trendline of the daily Triangle from the start of April (which has enclosed the previous waves B, i and ii).
The breakout of this Triangle should accelerate the active impulse wave iii, which belongs to the C-wave from last month.
Verizon can be expected to rise to the next resistance level 44.80 (top of the previous impulse wave (i) from last month).
Alexander Kuptsikevich,
Chief Market Analyst at FxPro
----------
Follow our Telegram channel t.me/fxpro dedicated to providing insightful market analysis and expertise.
Reach out to media.comments@fxpro.com for PR and media inquiries
Chief Market Analyst at FxPro
----------
Follow our Telegram channel t.me/fxpro dedicated to providing insightful market analysis and expertise.
Reach out to media.comments@fxpro.com for PR and media inquiries
Declinazione di responsabilità
Le informazioni ed i contenuti pubblicati non costituiscono in alcun modo una sollecitazione ad investire o ad operare nei mercati finanziari. Non sono inoltre fornite o supportate da TradingView. Maggiori dettagli nelle Condizioni d'uso.