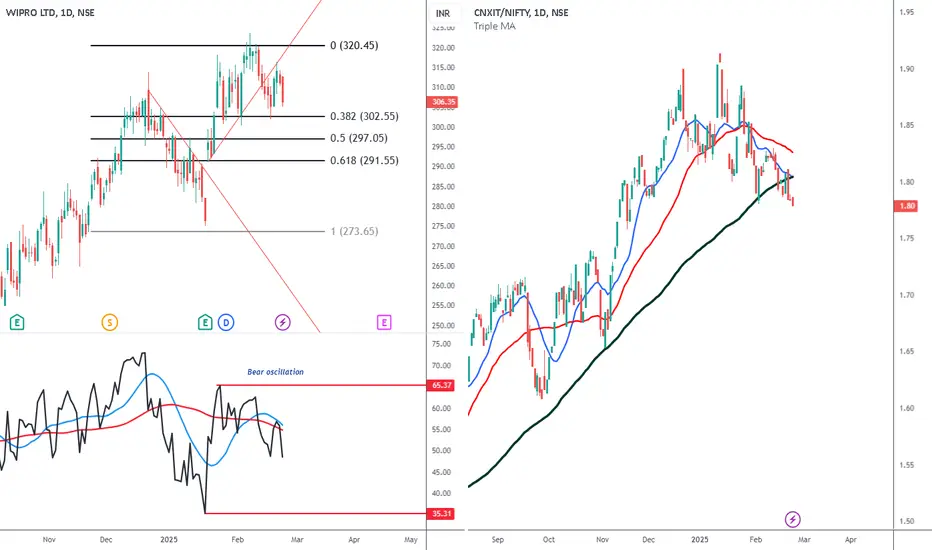
Left chart- Wipro
Right chart- Nifty IT Vs Nifty
Ratio Study- that the ratio is below all the three averages, is an indication that IT stocks will underperform Nifty. I had already stated that the correction in them is not over yet.
So three stocks which are a sell right now are Wipro, Infy and TechM, TCS will fall too but these are better bets as they have just started,
Declinazione di responsabilità
Le informazioni ed i contenuti pubblicati non costituiscono in alcun modo una sollecitazione ad investire o ad operare nei mercati finanziari. Non sono inoltre fornite o supportate da TradingView. Maggiori dettagli nelle Condizioni d'uso.
Declinazione di responsabilità
Le informazioni ed i contenuti pubblicati non costituiscono in alcun modo una sollecitazione ad investire o ad operare nei mercati finanziari. Non sono inoltre fornite o supportate da TradingView. Maggiori dettagli nelle Condizioni d'uso.