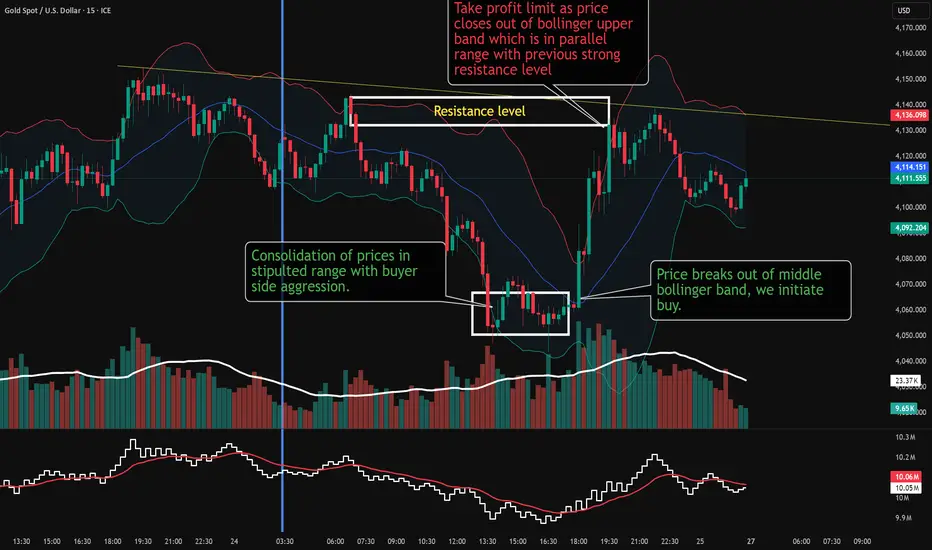
This chart illustrates a structured educational trade analysis on the XAU/USD (Gold vs US Dollar) instrument, showing how a professional analyst guides students through a trade setup using volume, price action, and Bollinger Bands.
Market Context
The chart begins during a high-volatility news event from the USA. Post-news, a large bullish candle formed with significant **impulse buyer volume**, indicated by the sharp price rise and high-volume bars. These **impulse buyers** enter aggressively after news releases but tend to **book profits soon after**. Analysts refer to them as opportunity creators because their trading footprints (volume clusters) reveal strong demand zones, which can later serve as high-probability entry points.
Identifying Opportunity Zones
The analyst points out that volume added beyond previous clusters signifies **fresh bullish participation**, confirming that strong buyers entered the market. This leaves a "volume footprint" — a strong **support level** around the base of that bullish candle. The teaching point here is that whenever price later revisits such a volume zone, it becomes a **potential re-entry area** aligned with institutional activity.
Trade Execution
Later, the same volume levels were retested, as shown in the chart. When price revisited this zone with declining bearish pressure and stable volume, the analyst initiated a **buy trade**. This buy aligns with:
- Retest of volume-supported demand area
- Lower band support of Bollinger Bands
- Confirmation of slowing volatility
This setup is a classic “volume-backed retest entry.”
Profit Booking and Volatility Analysis
As price climbed higher, **profits were booked** near the upper Bollinger Band, signaling volatility slowdown. The analyst explains that this is where price expansion peaks, and short-term traders ideally reduce or close positions to lock in profits. The Bollinger Band compression afterward suggests reduced volatility and temporary consolidation.
Key Educational Insights
1. Impulse volume after major news creates future trade opportunities.
2. Volume footprints** reveal institutional trading zones; retests of these zones are high-probability entries.
3. Bollinger Bands help identify overextension (for exits) and contraction phases (preparing for next moves).
4. Combining **volume + structure + volatility** improves timing and conviction in trade entries and exits.
In summary, the analyst demonstrates how to transform raw post-news volatility into an educated, systematic trade using volume behavior and volatility tools to guide student traders in professional decision-making.
Declinazione di responsabilità
Le informazioni ed i contenuti pubblicati non costituiscono in alcun modo una sollecitazione ad investire o ad operare nei mercati finanziari. Non sono inoltre fornite o supportate da TradingView. Maggiori dettagli nelle Condizioni d'uso.
Declinazione di responsabilità
Le informazioni ed i contenuti pubblicati non costituiscono in alcun modo una sollecitazione ad investire o ad operare nei mercati finanziari. Non sono inoltre fornite o supportate da TradingView. Maggiori dettagli nelle Condizioni d'uso.