Core Drivers
Expectations of Easing Support Gold Prices
The market anticipates a 25 basis point rate cut by the Federal Reserve in September with a probability exceeding 90%, potentially leading to two rate cuts this year. This lowers the cost of holding gold, an interest-free asset, and strengthens the medium- to long-term bullish outlook.
A modest rebound in the US dollar index (stabilizing after a one-week low) and rising US stocks will limit gold's gains in the short term, but risk aversion (due to trade uncertainty) provides hedging support.
Key Technical Signals
Daily Chart:
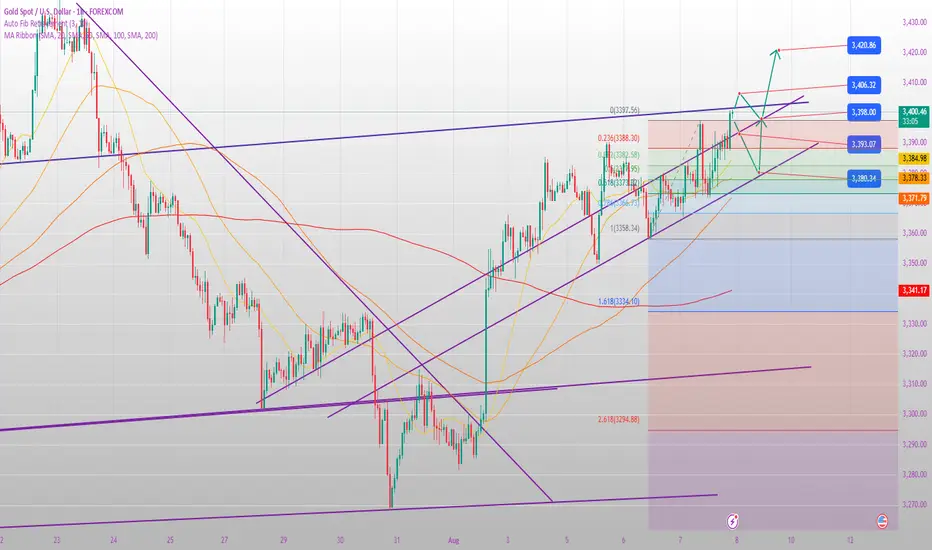
The market is nearing the end of a converging triangle, with upper support moving down to 3406 and lower support moving up to 3360.
Thursday's close firmly above the 5-day moving average, with the MACD trend showing a mild bullish bias. A break above 3400 would open up upside potential.
4-Hour Chart:
Middle support at 3371-3372 resonates with the daily 5-day moving average. A breakout above the downward trend line in the Asian session and a pullback confirm this, indicating a short-term bullish bias. The 4-hour MACD top divergence needs to be repaired. If the price retraces but does not break below 3370, the bullish outlook remains.
Day Trading Strategy
1. Long Opportunity
Entry Zone: 3370-3373 (618 retracement of overnight rally + 4-hour middle band support).
Target:
First target: 3397-3400 (Asian session high + psychological barrier).
After a breakout, target 3406 (upper band of the triangle), with further breakouts targeting 3420.
Stop Loss: Below 3365 (a break below would destroy the short-term upward trend).
2. Be cautious when shorting.
Conditions: If the gold price surges to around 3406 and then experiences pressure and a rapid decline, a small position can be considered for a short position.
Target: 3380-3375.
Stop Loss: Above 3412.
Key Risk Warning: US Dollar Trend: A sharp rebound in the US Dollar Index (e.g., above 104.5) could suppress gold prices. Fed Commentary: If Fed officials send hawkish signals (e.g., downplaying interest rate cuts), gold prices could pull back.
Triangle Breakout: A break below 3360 could trigger a potential drop to support levels of 3340-3330; a break above 3406 would confirm a new uptrend.
Trading Recommendations
Main Strategy: Invest primarily in low-level long positions, relying on support at 3370-3372, with a stop-loss at 3365 and a target of 3400-3406.
Alternative plan: short-term short selling under pressure at 3406, enter and exit quickly.
Breakthrough follow-up: If it stabilizes at 3400 after the European session, you can chase it to 3420; otherwise, if it falls below 3360, wait and see.
Trade attivo
Will a black swan event occur in gold on Friday, August 8th?
Key Trading Logic
Technical Patterns
A daily bullish breakout above 3400 confirms a short-term bullish trend, but a sharp rise and fall in the early Asian session suggests potential corrections, in line with the market principle that "sharp gains in early Asian sessions are difficult to sustain."
3380-3375 is the support zone following yesterday's breakout, with 3370 being the dividing line between strength and weakness (a break below would disrupt the upward trend).
Refined Trading Strategy
Option 1: Long on Pullbacks (Main Strategy)
Entry Zone: 3380-3375 (Small positions, phased in)
Stop-loss: Strictly set below 3370 (to prevent false breakouts)
Targets:
First target: 3400 (psychological pressure at the round number mark)
Second target: 3410 (positions can be reduced near previous highs)
Holding Conditions: Price must remain above 3385 within 1 hour; otherwise, exit early.
Option 2: Breakout Reversal (Alternative Strategy)
If the price breaks below 3370 and is confirmed by the 15-minute close:
Short position with a stop loss at 3378 and a target of 3355-3360 (previous support level).
Key Considerations:
Time Window:
If the price remains below 3400 during the Asian and European sessions, the probability of a pullback before the US market opens increases; avoid chasing higher prices.
During the US trading session, monitor the impact of US economic data on the US dollar.
Position Management:
During volatile trading, reduce your position to half of your normal level, keeping total risk below 2% of your account.
Alternative plan: If the gold price breaks through 3410, wait for confirmation of a pullback to 3400 before entering a long position (to avoid false breakouts).
Trader Psychology Tips:
Avoid blind optimism: Before the daily chart shows a continuous rise, approach the market in a step-by-step manner, achieving profit targets in stages.
Strict Discipline: After a surge in the early Asian session, there is usually a secondary bottom; be sure to wait for a confirmation signal.
(Note: Actual trading strategies should be adjusted based on real-time data and breaking news. It is recommended to use the 4-hour MACD and RSI indicators to verify momentum.)
Trade chiuso: obiettivo raggiunto
Will gold choose a clear direction on August 11th?
I. Current Gold Market Overview
Fundamental Factors
Safe-haven demand: Global trade tensions (such as Trump's tariff policy) and expectations of a September Fed rate cut continue to support gold prices.
Impact of the US dollar's trend: If the US dollar weakens due to weak economic data (such as the job market), gold prices may rise further; conversely, if the US dollar rebounds, gold prices may come under pressure.
Central Bank Gold Purchases: China continues to increase its gold reserves, which is positive for gold prices in the long term.
Key Technical Levels
Support: 3380 (4-hour Bollinger Band middle), 3364 (daily key support), 3350 (20-day moving average).
Resistance: 3409 (this week's high), 3415 (previous high), 3430-3450 (historical resistance zone).
II. Technical Analysis of Gold Trends
Daily Chart
Trend: The overall trend remains bullish, with the price stabilizing above the 20-day moving average (above 3350). The MACD forms a golden cross with high volume, but the RSI is approaching overbought territory, prompting caution against a pullback.
Key Observation: If the price closes above 3400, it could test 3430-3450. If it falls below 3380, it could retest the support levels of 3360-3350.
4-Hour Chart
Short-Term Momentum: The Bollinger Bands are opening upward, the price is moving along the upper band, and the MACD forms a second golden cross. However, the KDJ indicator is overbought and blunt, prompting concern about the effectiveness of the 3380 support level.
Key Breakout Directions:
Break above 3410 → target 3430-3450.
Break below 3380 → target 3360-3350.
1-Hour Chart
Swing Range: 3380-3410. If the US market breaks in this direction, trade accordingly.
III. Trading Strategy for August 11th
1. Main Trading Strategy: Buy on Pullbacks (Primarily Buy on Dips)
Entry Point: 3380-3370 (Buy after support stabilizes).
Stop Loss: Below 3360.
Target: 3400-3410 (Target 3430 after a breakout).
2. Short on Rebound Highs: Auxiliary Trading Strategy: Short on Rebound Highs
Entry Point: 3410-3415 (If a breakout fails).
Stop Loss: Above 3420.
Target: 3380-3360.
3. Breakout Strategy
Break above 3415 → Follow up with long orders on a pullback to 3400, target 3430-3450.
Break below 3360 → Short on a rebound to 3370, target 3350-3330.
IV. Risk Warning
Economic Data: This week's US inflation data and speeches by Federal Reserve officials may impact gold prices.
Geopolitical Risks: The US-Russia meeting and escalating trade wars could trigger market volatility.
Adhere to a strict stop-loss order: The current market is volatile and strong, but overbought signals exist, so be wary of a sudden pullback.
Conclusion: Gold remains bullish in the short term, but caution is advised against pullbacks from high levels. We recommend trading primarily in the 3380-3410 range, with a follow-up move after a breakout.
Pubblicazioni correlate
Declinazione di responsabilità
Le informazioni ed i contenuti pubblicati non costituiscono in alcun modo una sollecitazione ad investire o ad operare nei mercati finanziari. Non sono inoltre fornite o supportate da TradingView. Maggiori dettagli nelle Condizioni d'uso.
Pubblicazioni correlate
Declinazione di responsabilità
Le informazioni ed i contenuti pubblicati non costituiscono in alcun modo una sollecitazione ad investire o ad operare nei mercati finanziari. Non sono inoltre fornite o supportate da TradingView. Maggiori dettagli nelle Condizioni d'uso.