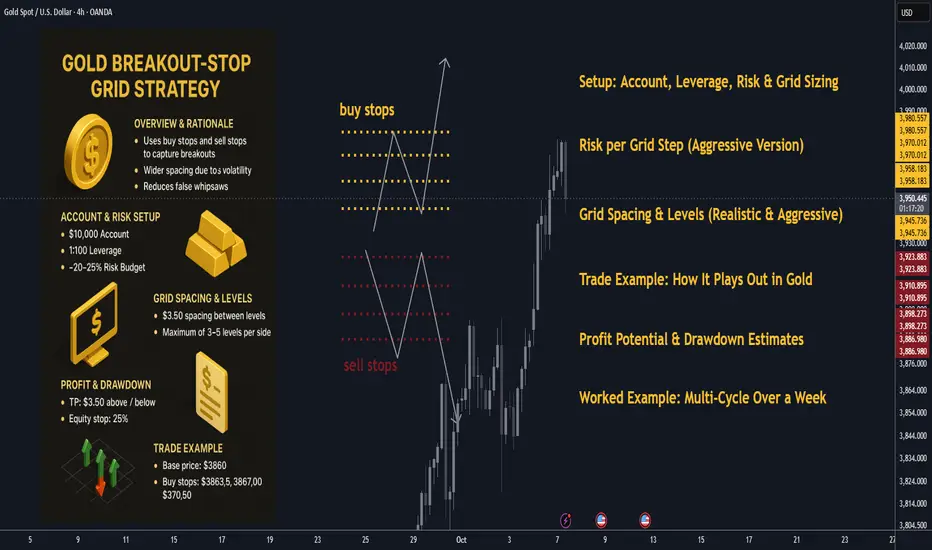
🪙 Gold Breakout-Stop Grid Strategy: Overview & Rationale
Grid trading is often built using limit orders above and below a base price, expecting the market to oscillate and capture many small profits. But in a strongly trending or volatile asset like gold, there is often breakout momentum that drives price through grid zones rather than bouncing.
By instead using buy stops above and sell stops below (i.e. breakout triggers), you capture directional thrusts, while still retaining a grid structure (i.e. multiple layers). Think of it as a hybrid between a breakout strategy and a grid.
Key advantages in gold:
• ✨ Gold often exhibits strong trending phases, with momentum after breakouts of supply/demand zones.
• 📊 Volatility is higher than many forex pairs, so you can space your grid more widely, reducing overcrowding.
• 🎯 With breakout stops, you reduce “false bounce” whipsaws inside the range; only when momentum validates do you trigger entries.
Risks / caveats:
• ⚠️ If price doesn’t break strongly and whipsaws, you could trigger and then reverse, creating drawdown.
• 📉 In a sideways gold market, fewer breakouts may be triggered, lowering trade frequency.
• 🛡 You must carefully size exposure and use drawdown controls, especially with leverage.
I’ll now walk through how to set this up, with gold-tailored specifics and sample trades (with increased aggressiveness), using realistic current spot prices (≈ $3,862) Investing.com.
________________________________________
🧮 Setup: Account, Leverage, Risk & Grid Sizing
📋 Account & Leverage
• Account size: $10,000
• Leverage: 1:100
• This means your maximum notional exposure is huge but margin and maintenance rules will limit you.
• We’ll now risk ~20–25%+ of equity in an aggressive version of this system (in order to aim for 20-30% weekly), i.e. $2,000–$2,500 at most drawdown limit for a grid run.
Note: This is very aggressive and only for demonstration. Many traders would never risk this much per grid.
💰 Risk per Grid Step (Aggressive Version)
• Let’s target $50 risk per triggered order (instead of $10) so that each step is meaningful.
• That means if a triggered order goes adverse by its maximum “stop zone,” your loss is $50.
• If you trigger, say, 5 steps, that’s $250 worst case on that direction (if all hit adverse).
• You must still cap total drawdown (e.g. 25% or $2,500) and limit exposures.
📈 Gold Contract & Price Movements
• Spot gold (XAU/USD) currently trades about $3,862.74 Investing.com.
• Let’s assume a contract specification such that 1 standard lot gives $100 per $1 move (so $1.00 move = $100) — a common ballpark in retail gold CFDs.
• Then:
• A move of $0.01 = $1 (for 1 lot).
• Therefore, if you trade 0.50 lots, a $1 move = $50.
So with this, to get ~$50 risk per $1 adverse move, 0.50 lots is a candidate (because $1 adverse × 0.50 lots × $100/lot = $50).
You can scale lot sizes accordingly.
📏 Grid Spacing & Levels (Realistic & Aggressive)
Given gold’s volatility, use wider spacing. Let’s choose:
• Grid spacing = $3.50 between successive triggers (a robust distance).
• We’ll place buy stops and sell stops relative to a base zone around current spot.
Let’s pick base ~ $3,860 as our pivot.
So:
• Buy stops: $3,863.50, $3,867.00, $3,870.50, $3,874.00, $3,877.50
• Sell stops: $3,856.50, $3,853.00, $3,849.50, $3,846.00, $3,842.50
(Max 5 levels each side, but you may cap to 3–5.)
Take Profit / Exit Logic:
• Target profit per trade = $3.50 (same as spacing).
• Thus one successful step = $3.50 × lot_size × $100.
• If lot_size = 0.50 lots, $3.50 × 0.50 × $100 = $175 profit per triggered trade.
• If you get 3 successful triggers in a run: 3 × $175 = $525 gross.
• That’s 5.25% on $10,000 in one clean directional run (before commissions/slippage).
You see the scaling is now aggressive — you risk more per step, but also gain more per successful trade. Limit how many triggers you allow (e.g. max 3–4 per side) to cap exposure.
Define a hard equity stop: e.g. if floating drawdown > 25% ($2,500), close all and reset.
________________________________________
🧭 Trade Example: How It Plays Out in Gold (Realistic Prices & Aggression)
We’ll do two detailed scenarios. This time we target higher returns, with real price zones.
________________________________________
🎯 Scenario A: Bullish Breakout
Base price: ~$3,860 (spot)
Buy stops: $3,863.50, $3,867.00, $3,870.50
Sell stops: $3,856.50, $3,853.00, $3,849.50
Lot sizing: 0.50 lots per order (so $3.50 adverse = $175 risk).
TP per trade: +$3.50
Sequence:
1. Gold climbs and breaks $3,863.50 → triggers Buy #1 at 3,863.50
o TP at 3,867.00 → profit if reached = ($3.50 × 0.50 × $100) = $175
2. Momentum continues, price breaks 3,867.00 → triggers Buy #2 there
o TP at 3,870.50 → another $175
3. Price surges, breaks 3,870.50 → triggers Buy #3 → TP = 3,874.00 → +$175
If all three succeed: Gross = $525 (5.25% gain) in one directional move.
If you allow up to 4 or 5 levels, total can scale to ~$700–900 (7–9%) in a strong move — if all hits. If reversal? If price reverses after buy #2, or before buy #3, you can:
• Close open longs immediately when opposite side’s sell stop triggers.
• Or cancel further buy stops once a reversal signal appears.
• Or net positions (if your broker supports hedging) — but that adds complexity.
Better to disable opposite side (sell stops) after the first buy triggers, to avoid collision exposures.
________________________________________
🔻 Scenario B: Bearish Breakout
Same base zone. Now price breaks downward.
• Sell stops at: 3,856.50, 3,853.00, 3,849.50
• TP each = –$3.50 from entry.
Sequence:
1. Gold breaks 3,856.50 → Sell #1 → target 3,853.00 → profit $175
2. Continues down, breaks 3,853.00 → Sell #2 → target 3,849.50 → +$175
3. Breaks 3,849.50 → Sell #3 → target 3,846.00 → +$175
If all three succeed: $525 profit.
If you allowed 4 levels: e.g. break 3,846.00 next → target 3,842.50 → +$175 more → total $700. Again, reversal risk must be managed.
________________________________________
📊 Mixed / Whipsaw Scenario
Suppose price crosses above $3,863.50 → triggers Buy #1, moves a bit, then reverses and crosses down through 3,856.50, triggering Sell #1.
You now hold:
• Long from $3,863.50 (losing)
• Short from $3,856.50 (potential profit)
This is a collision. To avoid chaotic risk:
• Cancel all opposite-side stops when first side triggers.
• Or immediately close all on first collision signal.
• Or lock in partial profit/loss and pause grid until trend clarity returns.
That’s why many breakout-grid strategies disable the opposite direction after first breakout.
________________________________________
📈 Profit Potential & Drawdown Estimates (Aggressive Model)
Let’s simulate one clean grid run (bullish) where 3 steps succeed fully:
• Gross profit = $525
• If you risked 3 steps * $175 = $525, worst-case these same 3 steps lose you $525 (if all adverse)
• Net = +5.25% in one run
• If you manage 2–3 such runs per week (if market allows), theoretically 10–15%+ weekly is possible — but that is optimistic.
However, in real life, not all runs will hit all targets — sometimes partial, sometimes losses. A drawdown of 25% ($2,500) is your cap boundary.
With that, if you undergo 5 bad runs in a row, you’d hit your equity stop.
If average win per run is $400 and average loss per bad run is $500, you need a favorable win-loss ratio to hit ~20–30% weekly. This is extremely aggressive.
________________________________________
🔁 Adaptive Mechanics & Enhancements (for robustness)
To improve consistency and manage risk, add:
• 📐 ATR-based spacing: Use a 14-period ATR on H4 or D1 to set grid spacing. If ATR = $4, spacing = $4 or $5.
• 📈 Trend filter: Only open buy-side grids when price > 200-period MA (H4 or D1), or only open sell-side when price < MA. Prevent fighting trend.
• 🚫 Volatility filter / news blocks: Do not place or trigger near major gold-related news (Fed, CPI, central bank announcements).
• 🔄 Grid rebase / reset: After a winning cycle, re-center grid around new price and restart stop orders.
• 📈 Scaling rules:
– Aggressive scaling: after n consecutive wins, increase lot size (within risk caps).
– Defensive scaling: after a loss, reduce lot size or skip grid.
• 🛑 Equity-stop / margin cap: If floating drawdown > 25% or margin usage > 80%, close all and reset.
• 🧊 Cooldown periods: After a loss or big run, pause grid orders for some hours/days to let market settle.
________________________________________
🧮 Worked Example: Multi-Cycle Over a Week (Aggressive)
Say you run 3 grid cycles in a week under trending conditions:
Cycle Direction Steps hit Gross profit Net (after one partial loss)
1 Up 3 out of 4 levels hit fully +$525 +$490 (small drawdown on partial)
2 Down 2 of 3 hit, 1 reversed +$350 +$320
3 Up 4 levels hit fully +$700 +$700
Total gross = $525 + $350 + $700 = $1,575
Net after adjustments/slippage ~ $1,450–$1,500
That’s ~ 14.5% gain in one week.
If the market is more favorable, you may hit ~20–30%, but the risk is commensurate.
Over multiple weeks the compounding is powerful — but a few big losses can wipe gains.
________________________________________
✅ Summary & Implementation Tips
• Use breakout stops (buy stops above, sell stops below) instead of limits to catch directional thrusts in gold.
• Wider grid spacing (e.g. $3–$5) is essential to survive volatility.
• Lot sizing must match your desired risk per step (here $50).
• Limit max triggers per direction and enforce a hard equity stop (e.g. 25%) to avoid blow-ups.
• Employ trend / volatility filters to filter low-probability entries.
• After a net winning run, rebase grid to current price.
• Use scaling and cooldown mechanics to moderate aggression.
• On collision signals, cancel opp side stops or close everything to avoid contradictory exposures.
Nota
🎁Please hit the like button and🎁Leave a comment to support our team!
Nota
Gold next week: Key S/R Levels and Outlook for Traders
taplink.cc/black001
🔱Syndicate Black MT4/MT5
⚡️Gold/FX Auto-Trading bot
🔱100%/week max DD <10%
📕verified 500%+ gains
🏧GOLD EA target 100%+ gains/week
🚀supercharge your trading
💎75% win rate gold signals
t.me/syndicategold001
🔱Syndicate Black MT4/MT5
⚡️Gold/FX Auto-Trading bot
🔱100%/week max DD <10%
📕verified 500%+ gains
🏧GOLD EA target 100%+ gains/week
🚀supercharge your trading
💎75% win rate gold signals
t.me/syndicategold001
Pubblicazioni correlate
Declinazione di responsabilità
Le informazioni ed i contenuti pubblicati non costituiscono in alcun modo una sollecitazione ad investire o ad operare nei mercati finanziari. Non sono inoltre fornite o supportate da TradingView. Maggiori dettagli nelle Condizioni d'uso.