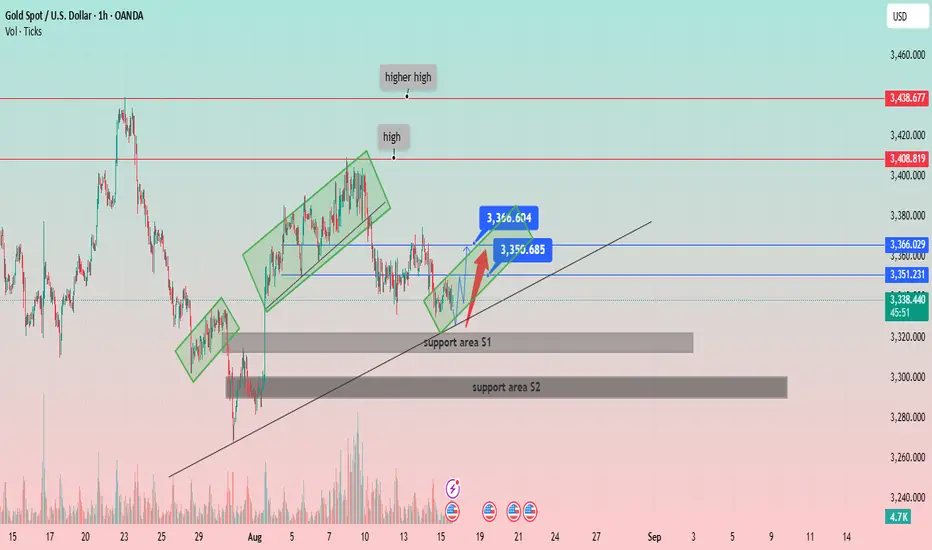
Price Structure: Gold has been forming a series of higher highs and higher lows, indicative of a general uptrend. The chart labels a "high" and a "higher high," confirming this bullish structure.
Support and Resistance:
Two key support areas are identified:
Support area S1: A narrow zone around 3,320 USD. The price recently bounced off this area.
Support area S2: A broader, more significant zone around 3,290 USD, which appears to have been a strong support level in the past.
Several horizontal resistance levels are marked:
Immediate resistance: Around 3,351.231 USD and 3,366.029 USD.
Higher resistance: At 3,408.819 USD and 3,438.677 USD.
Channels and Trendlines:
The price has been moving within a series of ascending channels (highlighted in green rectangles), suggesting a stair-step upward movement.
A primary ascending trendline (black line) serves as a long-term support, with the price currently hovering just above it.
Recent Price Action and Projections:
The price recently broke out of a small downtrend and is showing signs of recovery from the "support area S1."
A potential price path is drawn with a red arrow, indicating a possible move towards the immediate resistance levels around 3,351 USD and 3,366 USD.
The chart highlights two specific price points, 3,360.604 USD and 3,350.685 USD, which likely represent a short-term trading range or target.
Volume: The volume spikes visible at key price points (e.g., at the low on July 30 and during the recent drop) indicate strong market activity.
Trade chiuso: obiettivo raggiunto
almost all target achived
join my telegram channel free
t.me/Pips_and_profits1
t.me/Pips_and_profits1
Daily 300+pips profits
weekly 2000+pips profit
High accuracy signals with double conformation
t.me/Pips_and_profits1
t.me/Pips_and_profits1
Daily 300+pips profits
weekly 2000+pips profit
High accuracy signals with double conformation
Pubblicazioni correlate
Declinazione di responsabilità
Le informazioni e le pubblicazioni non sono intese come, e non costituiscono, consulenza o raccomandazioni finanziarie, di investimento, di trading o di altro tipo fornite o approvate da TradingView. Per ulteriori informazioni, consultare i Termini di utilizzo.