Last week both buy and sell levels hit for over 1000 pips each.
This will probably be my last chart for awhile as i dont think theres much intrest in this
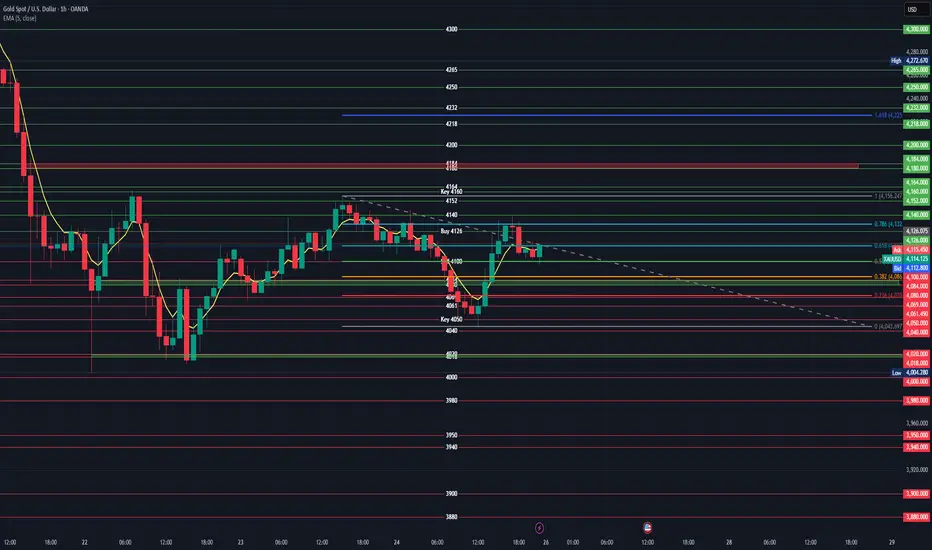
### XAUUSD 4-Hour Chart Analysis
#### **Key Levels Identified**
The chart shows critical **support/resistance zones** based on Fibonacci retracements, historical price action, and labeled key levels. Below is a breakdown of actionable buy/sell levels:
---
### **1. Buy Levels (Long Entry)**
These levels represent potential support where price may reverse upward:
- **Primary Buy Zone**: `4,126` (labeled "Buy 4126" on the chart)
- **Why?** This level aligns with the **0.236 Fibonacci retracement** of the recent swing high (4,164) to swing low (4,004). Historically, price has bounced here.
- **Entry Trigger**: Wait for bullish reversal signals (e.g., bullish engulfing candle, RSI divergence, or price closing above the 5-period EMA).
- **Stop Loss**: `4,095` (below the "Sell 4100" resistance level).
- **Take Profit**: Target `4,160` (Key 4160 resistance), then `4,180` and `4,184`.
- **Secondary Buy Zone**: `4,110–4,115` (near the 0.618 Fibonacci retracement at `4,113.253`)
- **Why?** The price is consolidating here after a dip. A hold above `4,100` (Sell 4100 level) suggests bullish momentum.
- **Stop Loss**: `4,095` (as above).
- **Take Profit**: Same as primary zone (`4,160` and beyond).
---
### **2. Sell Levels (Short Entry)**
These levels represent potential resistance where price may reverse downward:
- **Primary Sell Zone**: `4,132` (0.786 Fibonacci retracement of the swing high/low)
- **Why?** This level is a strong resistance zone where the price often reverses after a rally.
- **Entry Trigger**: Wait for bearish reversal signals (e.g., bearish pin bar, RSI divergence, or price rejecting the level).
- **Stop Loss**: `4,135` (above the resistance level).
- **Take Profit**: Target `4,099` (0.5 Fib), then `4,086` (0.382 Fib), and `4,050` (Key 4050 support).
- **Secondary Sell Zone**: `4,160` (labeled "Key 4160")
- **Why?** This is the **major swing high** (4,164) and a key psychological resistance level. A rejection here confirms a bearish trend.
- **Entry Trigger**: Price must break above `4,160` and then fail to hold (e.g., a bearish candlestick pattern at the level).
- **Stop Loss**: `4,165` (above the resistance level).
- **Take Profit**: Same as primary sell zone (`4,099` and below).
---
### **Critical Context**
- **Current Price**: `4,111.797` (EMA 5 close). This is **above support (`4,100`)** and **below resistance (`4,132`)**.
- **Trend**: Short-term downward momentum after the 4,164 high, but price is recovering from a low. Wait for confirmation of reversal.
- **Fibonacci Retracement**:
- `0.786` (4,132) and `0.618` (4,113) act as key resistance/support.
- `0.5` (4,099) and `0.382` (4,086) are stronger support levels.
- **Risk Management**:
- Always use a stop loss to limit downside risk.
- Target levels should align with the broader trend (e.g., if the trend is bearish, prioritize sell setups).
---
### **Summary of Actionable Levels**
| **Trade Type** | **Entry Level** | **Stop Loss** | **Take Profit** | **Confirmation Signal** |
|----------------|-----------------|---------------|-----------------|-------------------------|
| **Buy** | 4,126 (primary)<br>4,110–4,115 (secondary) | 4,095 | 4,160 → 4,180 → 4,184 | Bullish reversal candle, RSI divergence |
| **Sell** | 4,132 (primary)<br>4,160 (secondary) | 4,135 → 4,165 | 4,099 → 4,086 → 4,050 | Bearish reversal candle, RSI divergence |
> **Note**: Always validate entries with additional indicators (e.g., RSI, volume) and avoid trading during low-volume periods. The 4-hour timeframe favors medium-term trades (1–3 days), so patience is key.
This will probably be my last chart for awhile as i dont think theres much intrest in this
### XAUUSD 4-Hour Chart Analysis
#### **Key Levels Identified**
The chart shows critical **support/resistance zones** based on Fibonacci retracements, historical price action, and labeled key levels. Below is a breakdown of actionable buy/sell levels:
---
### **1. Buy Levels (Long Entry)**
These levels represent potential support where price may reverse upward:
- **Primary Buy Zone**: `4,126` (labeled "Buy 4126" on the chart)
- **Why?** This level aligns with the **0.236 Fibonacci retracement** of the recent swing high (4,164) to swing low (4,004). Historically, price has bounced here.
- **Entry Trigger**: Wait for bullish reversal signals (e.g., bullish engulfing candle, RSI divergence, or price closing above the 5-period EMA).
- **Stop Loss**: `4,095` (below the "Sell 4100" resistance level).
- **Take Profit**: Target `4,160` (Key 4160 resistance), then `4,180` and `4,184`.
- **Secondary Buy Zone**: `4,110–4,115` (near the 0.618 Fibonacci retracement at `4,113.253`)
- **Why?** The price is consolidating here after a dip. A hold above `4,100` (Sell 4100 level) suggests bullish momentum.
- **Stop Loss**: `4,095` (as above).
- **Take Profit**: Same as primary zone (`4,160` and beyond).
---
### **2. Sell Levels (Short Entry)**
These levels represent potential resistance where price may reverse downward:
- **Primary Sell Zone**: `4,132` (0.786 Fibonacci retracement of the swing high/low)
- **Why?** This level is a strong resistance zone where the price often reverses after a rally.
- **Entry Trigger**: Wait for bearish reversal signals (e.g., bearish pin bar, RSI divergence, or price rejecting the level).
- **Stop Loss**: `4,135` (above the resistance level).
- **Take Profit**: Target `4,099` (0.5 Fib), then `4,086` (0.382 Fib), and `4,050` (Key 4050 support).
- **Secondary Sell Zone**: `4,160` (labeled "Key 4160")
- **Why?** This is the **major swing high** (4,164) and a key psychological resistance level. A rejection here confirms a bearish trend.
- **Entry Trigger**: Price must break above `4,160` and then fail to hold (e.g., a bearish candlestick pattern at the level).
- **Stop Loss**: `4,165` (above the resistance level).
- **Take Profit**: Same as primary sell zone (`4,099` and below).
---
### **Critical Context**
- **Current Price**: `4,111.797` (EMA 5 close). This is **above support (`4,100`)** and **below resistance (`4,132`)**.
- **Trend**: Short-term downward momentum after the 4,164 high, but price is recovering from a low. Wait for confirmation of reversal.
- **Fibonacci Retracement**:
- `0.786` (4,132) and `0.618` (4,113) act as key resistance/support.
- `0.5` (4,099) and `0.382` (4,086) are stronger support levels.
- **Risk Management**:
- Always use a stop loss to limit downside risk.
- Target levels should align with the broader trend (e.g., if the trend is bearish, prioritize sell setups).
---
### **Summary of Actionable Levels**
| **Trade Type** | **Entry Level** | **Stop Loss** | **Take Profit** | **Confirmation Signal** |
|----------------|-----------------|---------------|-----------------|-------------------------|
| **Buy** | 4,126 (primary)<br>4,110–4,115 (secondary) | 4,095 | 4,160 → 4,180 → 4,184 | Bullish reversal candle, RSI divergence |
| **Sell** | 4,132 (primary)<br>4,160 (secondary) | 4,135 → 4,165 | 4,099 → 4,086 → 4,050 | Bearish reversal candle, RSI divergence |
> **Note**: Always validate entries with additional indicators (e.g., RSI, volume) and avoid trading during low-volume periods. The 4-hour timeframe favors medium-term trades (1–3 days), so patience is key.
Trade chiuso: obiettivo raggiunto
1330 pips on the sell , thats it from me Pubblicazioni correlate
Declinazione di responsabilità
Le informazioni e le pubblicazioni non sono intese come, e non costituiscono, consulenza o raccomandazioni finanziarie, di investimento, di trading o di altro tipo fornite o approvate da TradingView. Per ulteriori informazioni, consultare i Termini di utilizzo.
Pubblicazioni correlate
Declinazione di responsabilità
Le informazioni e le pubblicazioni non sono intese come, e non costituiscono, consulenza o raccomandazioni finanziarie, di investimento, di trading o di altro tipo fornite o approvate da TradingView. Per ulteriori informazioni, consultare i Termini di utilizzo.