On 1 day timeframe, the price action of XRP is described via Smart Money Concepts showing various key levels and zones over a period of little over year-to-date

NOTE 1:
From YTD (Jan 2025 - Aug 2025), XRP was moving sideways until the recent the upside movement
On observing end of June 2025 to Aug 2025 on the same timeframe

NOTE 2:
two trend lines can drawn which suggest the following
-- price may reach upto $3.8 if steeper trend lines is followed
-- price may consolidate between the two FVGs around $3.1 & $3.4
(both estimations are valid till August 30, 2025)
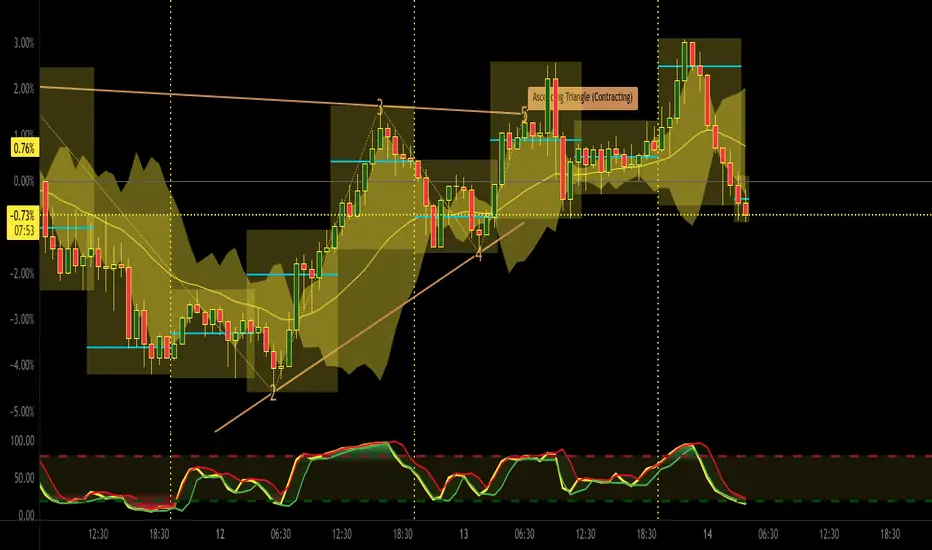
On 45 mins timeframe, the price is tracked by EMA with bollinger bands helping visualizing the volatility and strength of the move with probable highs and low points. It also contains RSI showing overbought and oversold conditions neatly

NOTE 3:
In previous 7 days,
-- 14 Points of Interest (price crossing/touching EMA line) can be observed
-- 10 oversold (buying chance) and 7 overbought (selling chance) can be seen via RSI
-- Price may fall down today (14th Aug 2025) to the steeper trend line (marked on 1D)
-- RSI suggesting buying chance is around the corner
On 3 mins timeframe, price is observed over three 8-hours session-a-day. A LSMA and Supertrend is used to carve-out 1 or 2 good moves in a session.

NOTE 4:
In today's first 8 hour session,
-- an upside move followed by a sharp downside move can be seen
-- both moves had good volume
-- LSMA sugggested potential reversal to downside before it actually happened
-- Supertrend highlights the trend in the session

SUGGESTION
1. Use RSI for signals of buy / sell, on 45 min timeframe (higher timeframe signal)
2. Use Supertrend as confirmation of the RSI signal (lowe timeframe confirmation)
3. Build the position over next dew days
TIP:
Wait for the RSI (yellow) line to overlap the red line and show the green line before entry
:)
NOTE 1:
From YTD (Jan 2025 - Aug 2025), XRP was moving sideways until the recent the upside movement
On observing end of June 2025 to Aug 2025 on the same timeframe
NOTE 2:
two trend lines can drawn which suggest the following
-- price may reach upto $3.8 if steeper trend lines is followed
-- price may consolidate between the two FVGs around $3.1 & $3.4
(both estimations are valid till August 30, 2025)
On 45 mins timeframe, the price is tracked by EMA with bollinger bands helping visualizing the volatility and strength of the move with probable highs and low points. It also contains RSI showing overbought and oversold conditions neatly
NOTE 3:
In previous 7 days,
-- 14 Points of Interest (price crossing/touching EMA line) can be observed
-- 10 oversold (buying chance) and 7 overbought (selling chance) can be seen via RSI
-- Price may fall down today (14th Aug 2025) to the steeper trend line (marked on 1D)
-- RSI suggesting buying chance is around the corner
On 3 mins timeframe, price is observed over three 8-hours session-a-day. A LSMA and Supertrend is used to carve-out 1 or 2 good moves in a session.
NOTE 4:
In today's first 8 hour session,
-- an upside move followed by a sharp downside move can be seen
-- both moves had good volume
-- LSMA sugggested potential reversal to downside before it actually happened
-- Supertrend highlights the trend in the session
SUGGESTION
1. Use RSI for signals of buy / sell, on 45 min timeframe (higher timeframe signal)
2. Use Supertrend as confirmation of the RSI signal (lowe timeframe confirmation)
3. Build the position over next dew days
TIP:
Wait for the RSI (yellow) line to overlap the red line and show the green line before entry
:)
Declinazione di responsabilità
Le informazioni ed i contenuti pubblicati non costituiscono in alcun modo una sollecitazione ad investire o ad operare nei mercati finanziari. Non sono inoltre fornite o supportate da TradingView. Maggiori dettagli nelle Condizioni d'uso.
Declinazione di responsabilità
Le informazioni ed i contenuti pubblicati non costituiscono in alcun modo una sollecitazione ad investire o ad operare nei mercati finanziari. Non sono inoltre fornite o supportate da TradingView. Maggiori dettagli nelle Condizioni d'uso.