Hello, traders.
If you "Follow" us, you'll always get the latest information quickly.
Have a great day.
-------------------------------------
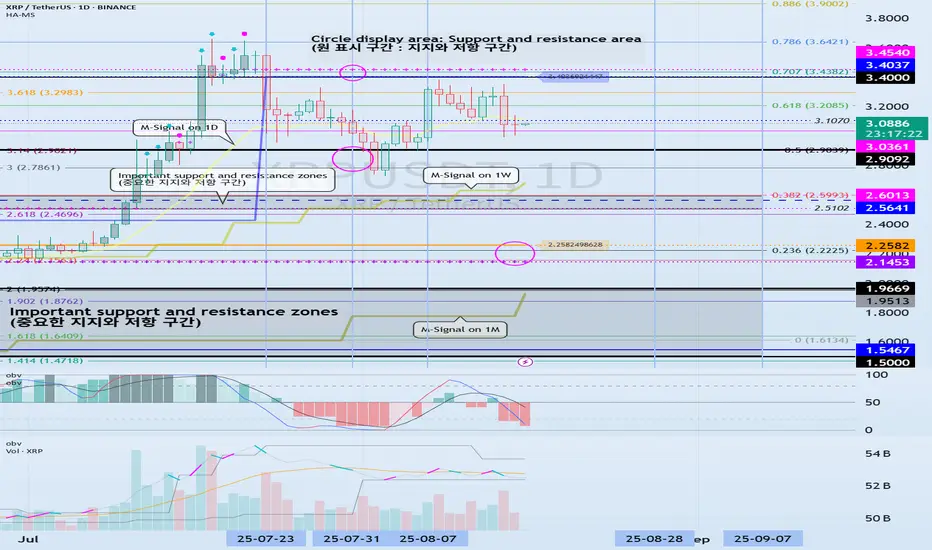
(XRPUSDT 1D Chart)
If the price falls below the 1.5-1.9669 range, a major downtrend is likely to begin.
To maintain the uptrend, the price must hold above the 2.5102-2.6013 range.
If the price falls below the M-Signal on the 1D chart, it is highly likely to meet the M-Signal indicator on the 1W chart.
In that sense, we should check for support around the previous all-time high (ATH) area of 2.9092.
The next period of volatility is around August 28th.
However, since BTC's volatility period is around August 24th, you should closely monitor its movements from around that time.
-
(1M Chart)
While it's virtually impossible to predict the price as it's currently hitting a new all-time high (ATH), the area marked by a circle could potentially become a resistance zone.
The key is whether the price can maintain its upward momentum above the Fibonacci range of 0.618 (3.2085) on the right and 3.618 (3.2983) on the left.
The Fibonacci range on the left was drawn during the first wave.
-
Thank you for reading.
I wish you successful trading.
--------------------------------------------------
- This is an explanation of the big picture.
(3-year bull market, 1-year bear market pattern)

I will explain in more detail when the bear market begins.
------------------------------------------------------
※ Follow X to check out the posts.
※ X를 팔로우하고 게시물을 확인하세요.
◆ t.me/readCryptoChannel
[HA-MS Indicator]
bit.ly/3YxHgvN
[OBV Indicator]
bit.ly/4dcyny3
※ X를 팔로우하고 게시물을 확인하세요.
◆ t.me/readCryptoChannel
[HA-MS Indicator]
bit.ly/3YxHgvN
[OBV Indicator]
bit.ly/4dcyny3
Pubblicazioni correlate
Declinazione di responsabilità
Le informazioni e le pubblicazioni non sono intese come, e non costituiscono, consulenza o raccomandazioni finanziarie, di investimento, di trading o di altro tipo fornite o approvate da TradingView. Per ulteriori informazioni, consultare i Termini di utilizzo.