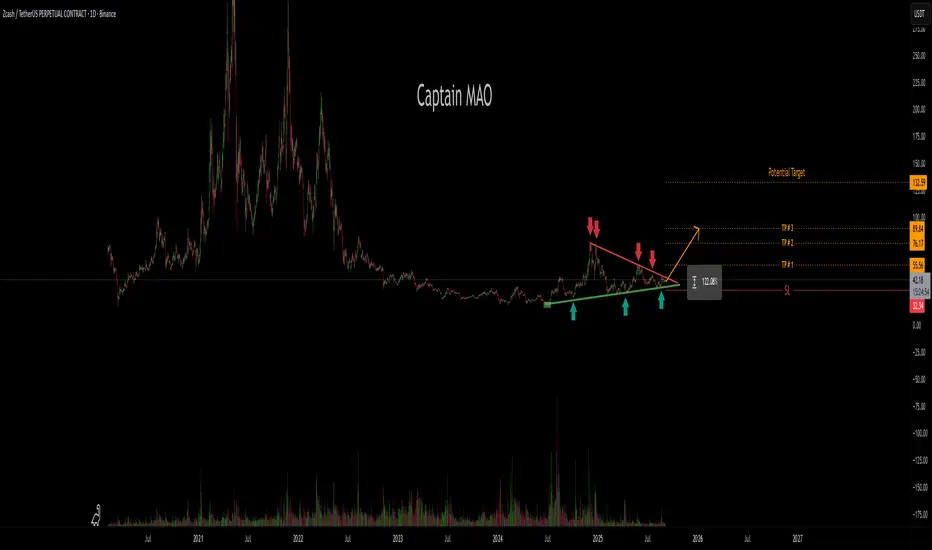
For the past 9+ months, ZEC/USDT has been in a prolonged correction and consolidation phase, forming a huge symmetrical triangle pattern. This structure reflects a balance between buyers and sellers, with volatility compressing as price coils tighter toward the apex of the triangle.
Price action is now approaching a decisive point. According to the 5th-touch breakout rule, the 5th attempt to test trendline support or resistance often results in a make-or-break breakout.
If buyers seize control, a confirmed breakout above the triangle could trigger a powerful expansion move. Conversely, failure to hold the apex level could result in a downside continuation.
Nota
111% so far TP1&TP#2 hiNota
TP#3 132% Trade chiuso: obiettivo raggiunto
Boom 248% all take profit price hit time to rest 🧠 8+ yrs in crypto & Forex | ⚡ Scalp & swing trader | 📊 Price action lover | 🎯 Hunting setups daily ✅
Declinazione di responsabilità
Le informazioni e le pubblicazioni non sono intese come, e non costituiscono, consulenza o raccomandazioni finanziarie, di investimento, di trading o di altro tipo fornite o approvate da TradingView. Per ulteriori informazioni, consultare i Termini di utilizzo.
🧠 8+ yrs in crypto & Forex | ⚡ Scalp & swing trader | 📊 Price action lover | 🎯 Hunting setups daily ✅
Declinazione di responsabilità
Le informazioni e le pubblicazioni non sono intese come, e non costituiscono, consulenza o raccomandazioni finanziarie, di investimento, di trading o di altro tipo fornite o approvate da TradingView. Per ulteriori informazioni, consultare i Termini di utilizzo.