Analysis Overview:
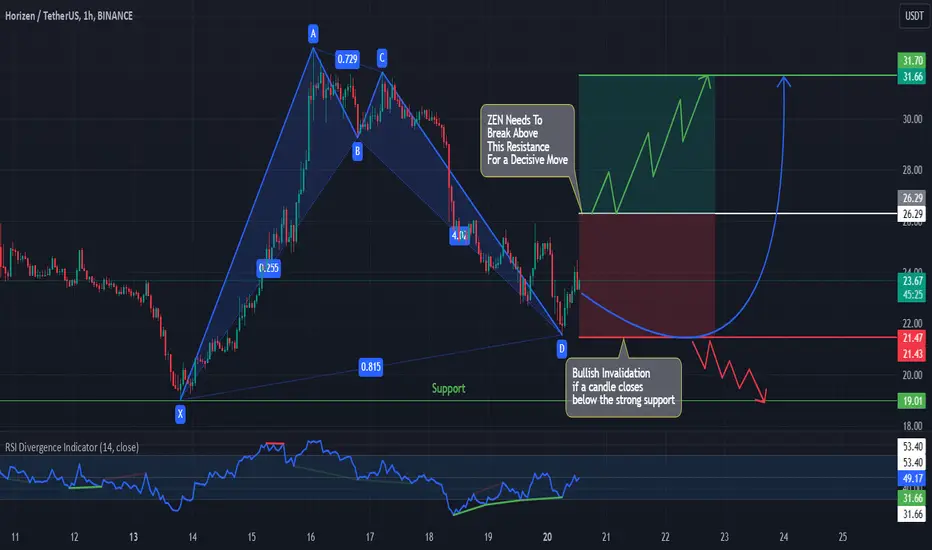
ZEN is currently in a downtrend but is forming a potential Harmonic Pattern on the 1-hour timeframe. This is accompanied by Bullish Divergence, which suggests a possible trend reversal to the upside.
For a confirmed bullish trend, we need a decisive breakout above the previous Lower Highs (LHs). Once this occurs, the price structure may shift, forming Higher Highs (HHs) and Higher Lows (HLs), reinforcing a bullish outlook.
Trading Plan:
Entry Trigger: Wait for a breakout above the previous LHs as confirmation.
Risk Management: Use a well-defined stop-loss level below the recent swing low to minimize risks.
Target: Gradually scale into the position as HHs and HLs form, aiming for key resistance levels.
Note: Always adhere to your trading plan and risk management rules. Wait for confirmation before entering a trade.
Nota
Trade is Still valid, move ur buy order to 23.50 and SL to 18.85Declinazione di responsabilità
Le informazioni ed i contenuti pubblicati non costituiscono in alcun modo una sollecitazione ad investire o ad operare nei mercati finanziari. Non sono inoltre fornite o supportate da TradingView. Maggiori dettagli nelle Condizioni d'uso.
Declinazione di responsabilità
Le informazioni ed i contenuti pubblicati non costituiscono in alcun modo una sollecitazione ad investire o ad operare nei mercati finanziari. Non sono inoltre fornite o supportate da TradingView. Maggiori dettagli nelle Condizioni d'uso.