OPEN-SOURCE SCRIPT
Cybernetic Sine Wave
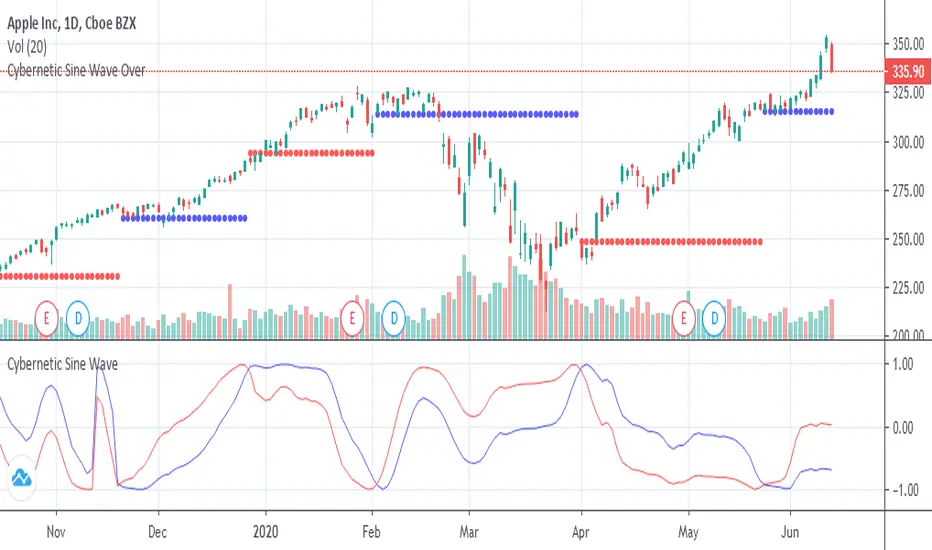
This is John F. Ehlers "Sine Wave Indicator" on the book "Cybernetic Analysis for Stocks and Futures".
When red crosses under blue there is a resistance and the price should fall and when red crosses over blue there is a support and the price should rise, but, the market is always right,
if instead of turning down on the resistance it surpasses it there is a trend up, if instead of turning up on the the support it falls through it there is a trend down.
Script open-source
Nello spirito di TradingView, l'autore di questo script lo ha reso open source, in modo che i trader possano esaminarne e verificarne la funzionalità. Complimenti all'autore! Sebbene sia possibile utilizzarlo gratuitamente, ricordiamo che la ripubblicazione del codice è soggetta al nostro Regolamento.
Declinazione di responsabilità
Le informazioni e le pubblicazioni non sono intese come, e non costituiscono, consulenza o raccomandazioni finanziarie, di investimento, di trading o di altro tipo fornite o approvate da TradingView. Per ulteriori informazioni, consultare i Termini di utilizzo.