OPEN-SOURCE SCRIPT
ZScore Plot with Ranked Table
Version 0.1
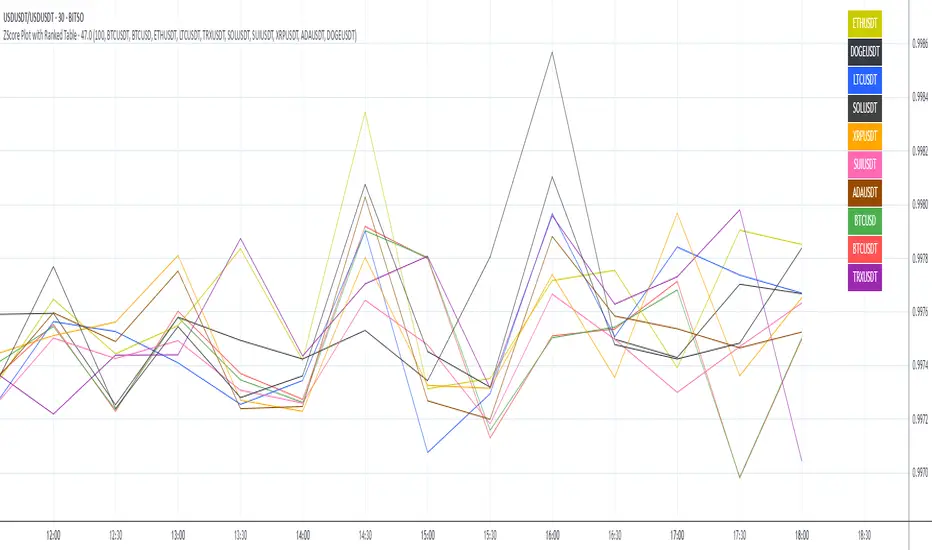
ZScore Plot with Ranked Table — Overview
This indicator visualizes the rolling ZScores of up to 10 crypto assets, giving traders a normalized view of log return deviations over time. It's designed for volatility analysis, anomaly detection, and clustering of asset behavior.
🎯 Purpose
• Show how each asset's performance deviates from its historical mean
• Identify potential overbought/oversold conditions across assets
• Provide a ranked leaderboard to compare asset behavior instantly
⚙️ Inputs
• Lookback: Number of bars to calculate mean and standard deviation
• Asset 1–10: Choose up to 10 symbols (e.g. BTCUSDT, ETHUSDT)
📈 Outputs
• ZScore Lines: Each asset plotted on a normalized scale (mean = 0, SD = 1)
• End-of-Line Labels: Asset names displayed at latest bar
• Leaderboard Table: Ranked list (top-right) showing:
◦ Asset name (color-matched)
◦ Final ZScore (rounded to 3 decimals)
🧠 Use Cases
• Quantitative traders seeking cross-asset momentum snapshots
• Signal engineers tracking volatility clusters
• Risk managers monitoring outliers and systemic shifts
Script open-source
Nello spirito di TradingView, l'autore di questo script lo ha reso open source, in modo che i trader possano esaminarne e verificarne la funzionalità. Complimenti all'autore! Sebbene sia possibile utilizzarlo gratuitamente, ricordiamo che la ripubblicazione del codice è soggetta al nostro Regolamento.
Declinazione di responsabilità
Le informazioni e le pubblicazioni non sono intese come, e non costituiscono, consulenza o raccomandazioni finanziarie, di investimento, di trading o di altro tipo fornite o approvate da TradingView. Per ulteriori informazioni, consultare i Termini di utilizzo.