OPEN-SOURCE SCRIPT
Chaikin Oscillator with EMA and Alerts
Overview
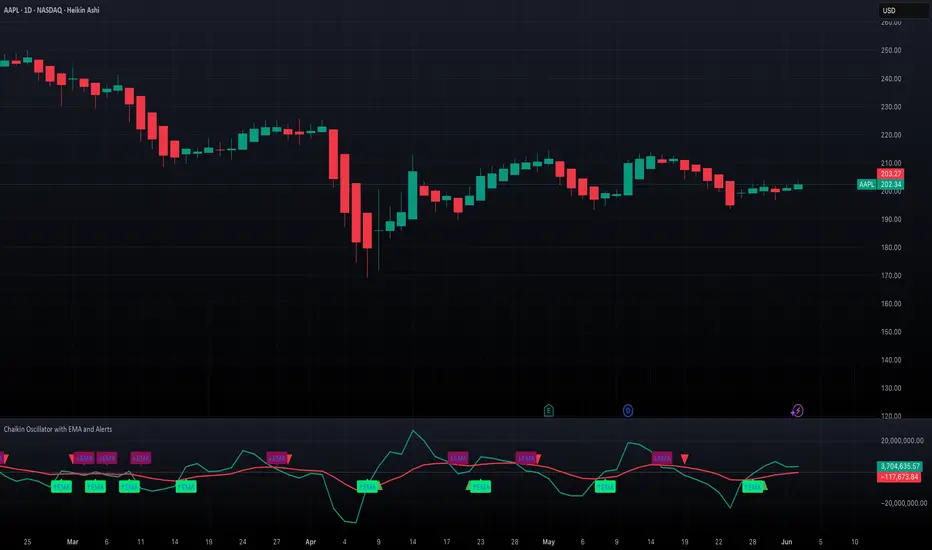
This indicator plots the classic Chaikin Oscillator along with an EMA overlay to help identify changes in accumulation or distribution momentum. It includes visual markers and built-in alerts for key crossover events such as crossing the zero line and crossing above or below the Chaikin EMA.
Concepts
The Chaikin Oscillator is calculated as the difference between two EMAs of Accumulation/Distribution (A/D) volume. It is used to measure the momentum behind buying and selling pressure. An EMA is applied to the oscillator itself to smooth out signals and provide an additional layer of trend confirmation. Crossovers above or below zero, and above or below the EMA, are interpreted as potential signals of market sentiment shifts.
How to Use the Indicator
Apply the indicator to any chart and select your preferred short, long, and EMA lengths. The script will plot the Chaikin Oscillator in teal and its EMA in red. Triangles and labels will appear on the chart when the oscillator crosses above or below the zero line, or when it crosses its EMA. Green triangles indicate bullish zero-line crossovers, while red triangles indicate bearish ones. Lime and maroon labels signal EMA crossovers. Use these signals to assess momentum shifts and potential entry or exit points.
Interpretation
When the Chaikin Oscillator is above zero and rising, it suggests strong buying pressure. When it is below zero and falling, it suggests strong selling pressure. A crossover above the EMA may indicate an emerging bullish trend, while a crossover below the EMA may suggest increasing bearish momentum. Using both the zero line and EMA crossover together helps filter noise and improves reliability of momentum-based signals.
Notes
The indicator includes four alert conditions that can be enabled in TradingView to notify you of Chaikin Oscillator crossovers. It works across all asset classes and timeframes. This tool is especially useful for identifying momentum shifts ahead of price moves and for confirming volume-based signals in trend continuation or reversal scenarios. Adjust input lengths to suit your trading style or the volatility of the instrument you are analyzing.
Script open-source
Nello spirito di TradingView, l'autore di questo script lo ha reso open source, in modo che i trader possano esaminarne e verificarne la funzionalità. Complimenti all'autore! Sebbene sia possibile utilizzarlo gratuitamente, ricordiamo che la ripubblicazione del codice è soggetta al nostro Regolamento.
Declinazione di responsabilità
Le informazioni e le pubblicazioni non sono intese come, e non costituiscono, consulenza o raccomandazioni finanziarie, di investimento, di trading o di altro tipo fornite o approvate da TradingView. Per ulteriori informazioni, consultare i Termini di utilizzo.