OPEN-SOURCE SCRIPT
Dynamic Autocorrelation Visualizer (YavuzAkbay)
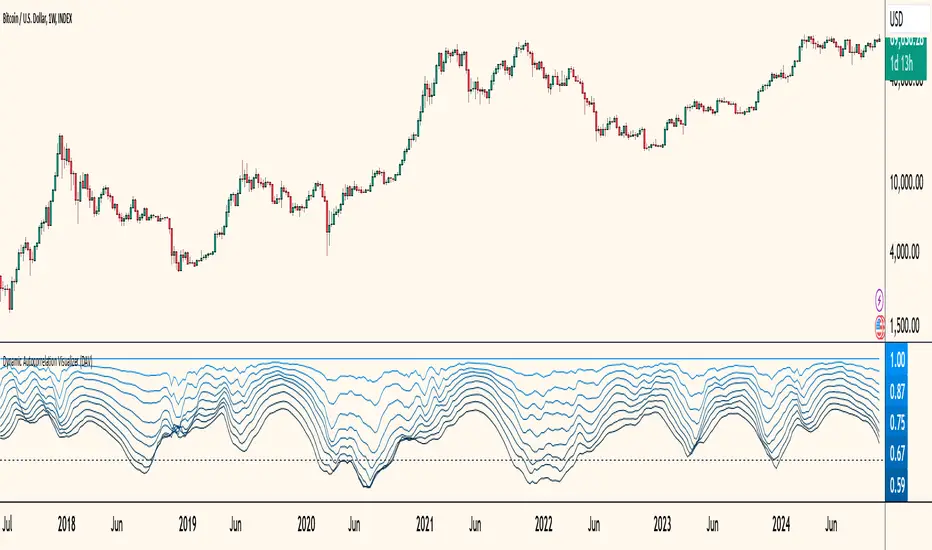
The Dynamic Autocorrelation Visualizer (DAV) is a specialized indicator that analyzes and displays the autocorrelation of closing prices over multiple time lags. The autocorrelation function is a well-established economic calculation that measures how past price movements correlate with current prices at various intervals. This indicator implements this function to provide traders with insights into how these correlations evolve over time, enabling them to identify shifts in market behavior and trends.
Key Features and Functionality
1. Input Parameters:
2. Autocorrelation Calculation:
3. Visualization:
Indicator is Useful for
How to Use the DAV Indicator
Before using the indicator, it should be backtested on the chart and the mechanics should be learned. In general, if all lags of the indicator are above 0, it means that the trend is continuing. When the lags start to fall below 0 one by one, it means a trend reversal or instability. The indicator is in a sense a 90 degree freeze trace of the Autocorrelation indicator that I have also integrated into Tradingview (available in my profile), so it may be more understandable if used in conjunction with this indicator.
Key Features and Functionality
1. Input Parameters:
- Max Lag: This parameter determines the maximum number of lags for which the autocorrelation will be calculated. By default, it is set to 10, allowing traders to observe the correlation from the most recent price up to 10 periods back.
- Calculation Period: The period over which the autocorrelation is calculated, set by default to 50. This setting allows users to adapt the analysis to different time frames depending on their trading strategies.
2. Autocorrelation Calculation:
- The DAV calculates the average closing price over the specified period using the Simple Moving Average (SMA). This average serves as a reference point for measuring deviations in price behavior.
- It then computes the denominator for the autocorrelation formula, which is the sum of the squared differences between each closing price and the average price. This normalization ensures that the autocorrelation values are meaningful and statistically valid.
- For each specified lag (from 0 to max_lag - 1), the indicator calculates the numerator by summing the product of deviations from the mean for both the current and lagged prices. The autocorrelation value for each lag is then derived by dividing the numerator by the denominator, producing a set of autocorrelation values that reflect the strength and direction of price relationships over time.
3. Visualization:
- The results for each lag's autocorrelation are plotted as individual lines on the chart, each differentiated by color to represent different lag periods.
- A zero line is drawn as a reference, helping traders easily identify when autocorrelation values cross from positive to negative or vice versa.
- The color gradient from the brightest blue (for lag 1) to darker shades indicates the relative strength of the autocorrelation for each lag, providing an immediate visual cue for analysis.
Indicator is Useful for
- Seeing how correlation patterns evolve
- Identifying periods where the market changes its behavior
- Spotting when certain lag patterns become more or less significant
How to Use the DAV Indicator
Before using the indicator, it should be backtested on the chart and the mechanics should be learned. In general, if all lags of the indicator are above 0, it means that the trend is continuing. When the lags start to fall below 0 one by one, it means a trend reversal or instability. The indicator is in a sense a 90 degree freeze trace of the Autocorrelation indicator that I have also integrated into Tradingview (available in my profile), so it may be more understandable if used in conjunction with this indicator.
Script open-source
Nello spirito di TradingView, l'autore di questo script lo ha reso open source, in modo che i trader possano esaminarne e verificarne la funzionalità. Complimenti all'autore! Sebbene sia possibile utilizzarlo gratuitamente, ricordiamo che la ripubblicazione del codice è soggetta al nostro Regolamento.
Declinazione di responsabilità
Le informazioni e le pubblicazioni non sono intese come, e non costituiscono, consulenza o raccomandazioni finanziarie, di investimento, di trading o di altro tipo fornite o approvate da TradingView. Per ulteriori informazioni, consultare i Termini di utilizzo.