PROTECTED SOURCE SCRIPT
Aggiornato Market Breadth - Secondary Indicator
Market Breath is the equilibrium between number of stocks in advance to those in a decline, in other words a method to determine the current market environment. In a positive phase bullish setups will have improved probabilities and presence, whereas in a bearish phase the opposite would be true.
The primary indicator is the main tool used to identify whether the market is favorable for bullish- or bearish setups. The secondary indicator is complementary, with the purpose to calculate the intensity of each phase. In other words, overbought or oversold conditons.
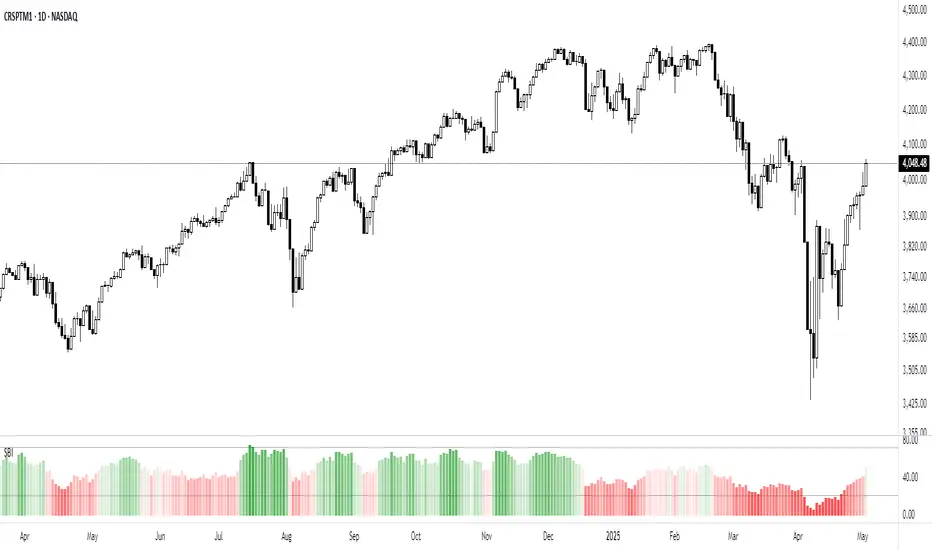
The calculations are made based on the MMFI (% of stocks above 50 DMA).
- Red Column: Value below 21 would be considered oversold, where 10 < would be extreme / capitulation.
- Green Column: Value above 72 would be considered overbought, however in a stable bullish phase would on the contrary indicate positive acceleration.
There are also prints of dots that are created around / end of these extremes, which can indicate a reversal attempt. This will be printed when there is a countertrend move in the MMFI, VIX and SPY from an extreme value.
- Red Dots: Countertrend (down expansion) from a bullish phase.
- Green Dots: Countertrend (up expansion) from a bearish phase.
- Black Dots: Countertrend (up expansion) from an extreme / deep bearish phase.
How To Use
Use the primary indicator to note whether the market is more favorable for bullish- or bearish setups. Then look at the secondary breadth indicator and note whether there are extreme numbers and take that into account with a discretionary perspective. Example In case the market is in a bearish phase, have extended to the downside for several weeks and the primary breadth indicator is bearish. But he secondary show oversold levels with reversal prints, one should consider to be more careful on short side to risk of mean reversion. In simple terms these can be used to determine whether the current market is appropriate for selected setups.
The primary indicator is the main tool used to identify whether the market is favorable for bullish- or bearish setups. The secondary indicator is complementary, with the purpose to calculate the intensity of each phase. In other words, overbought or oversold conditons.
The calculations are made based on the MMFI (% of stocks above 50 DMA).
- Red Column: Value below 21 would be considered oversold, where 10 < would be extreme / capitulation.
- Green Column: Value above 72 would be considered overbought, however in a stable bullish phase would on the contrary indicate positive acceleration.
There are also prints of dots that are created around / end of these extremes, which can indicate a reversal attempt. This will be printed when there is a countertrend move in the MMFI, VIX and SPY from an extreme value.
- Red Dots: Countertrend (down expansion) from a bullish phase.
- Green Dots: Countertrend (up expansion) from a bearish phase.
- Black Dots: Countertrend (up expansion) from an extreme / deep bearish phase.
How To Use
Use the primary indicator to note whether the market is more favorable for bullish- or bearish setups. Then look at the secondary breadth indicator and note whether there are extreme numbers and take that into account with a discretionary perspective. Example In case the market is in a bearish phase, have extended to the downside for several weeks and the primary breadth indicator is bearish. But he secondary show oversold levels with reversal prints, one should consider to be more careful on short side to risk of mean reversion. In simple terms these can be used to determine whether the current market is appropriate for selected setups.
Note di rilascio
Gradient color on MMFINote di rilascio
Absolute value for SPY price expansion.Note di rilascio
Counter indicator (dots) are still experimental, now use a different code (derived from SPY, MMFI, MMFD and VIX).Note di rilascio
Added indication for breadth thrusts, which is the ratio between stocks in advance and decline. Condition would be met when either one outnumber with => 2 ratio over 10 days. This can indicate market turns and acceleration. Is printed in shape of arrows in the indicator panel.Note di rilascio
Default LabelsNote di rilascio
This version is based exclusively on the MMFI, which measures the percentage of U.S. stocks trading above their 50-day moving average.The script has been simplified by removing redundant overlays and secondary inputs. Gradient coloration has been added, and visual thresholds are shown at the 72% and 21% levels.
Script protetto
Questo script è pubblicato come codice protetto. Tuttavia, è possibile utilizzarlo liberamente e senza alcuna limitazione – per saperne di più clicca qui.
Technical Trading: Research and Application
stockleave.com/
stockleave.com/
Declinazione di responsabilità
Le informazioni ed i contenuti pubblicati non costituiscono in alcun modo una sollecitazione ad investire o ad operare nei mercati finanziari. Non sono inoltre fornite o supportate da TradingView. Maggiori dettagli nelle Condizioni d'uso.