OPEN-SOURCE SCRIPT
VXN Williams %R
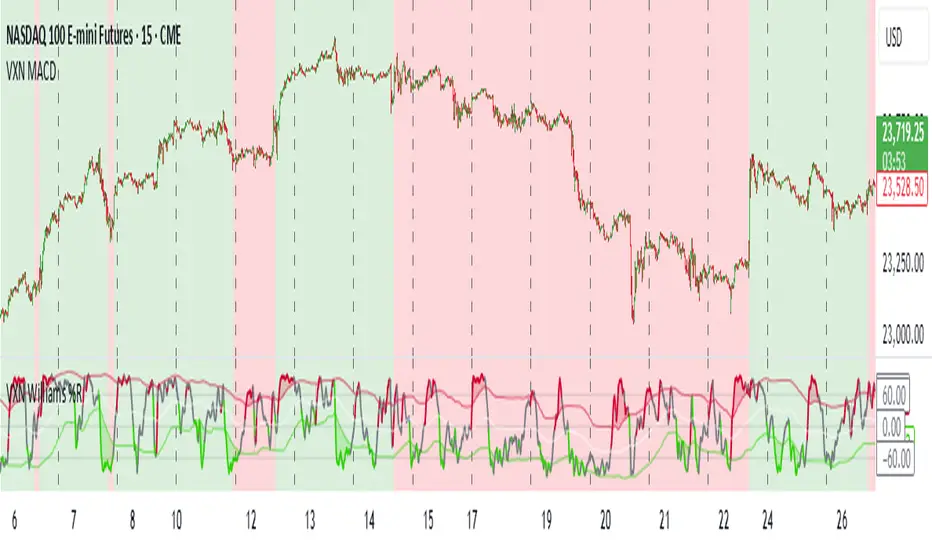
This indicator is based on other open source scripts. It's designed for trading NASDAQ futures using the Williams %R oscillator combined with Bollinger Bands.
The Williams %R is calculated based on a user-defined source and period, then smoothed with a moving average (SMA, EMA, WMA, or RMA).
Bollinger Bands are applied to the scaled Williams %R to identify overbought and oversold conditions.
The background color reflects the trend of the VXN (CBOE NASDAQ Volatility Index):
- Green background: Indicates a bullish trend (VXN EMA < VXN SMA), suggesting long entries at green peaks (Williams %R crossing above the upper Bollinger Band).
- Red background: Indicates a bearish trend (VXN EMA > VXN SMA), suggesting short entries at red peaks (Williams %R crossing below the lower Bollinger Band).
Script open-source
In pieno spirito TradingView, il creatore di questo script lo ha reso open-source, in modo che i trader possano esaminarlo e verificarne la funzionalità. Complimenti all'autore! Sebbene sia possibile utilizzarlo gratuitamente, ricorda che la ripubblicazione del codice è soggetta al nostro Regolamento.
Declinazione di responsabilità
Le informazioni ed i contenuti pubblicati non costituiscono in alcun modo una sollecitazione ad investire o ad operare nei mercati finanziari. Non sono inoltre fornite o supportate da TradingView. Maggiori dettagli nelle Condizioni d'uso.