OHO ATM Machine
We have used different type of candle stick patterns, open, close, high, low, Moving Averages, volumes and Average True Ranges in creation of this indicator.
Usage:
It can be used for scalping and intra-day trading. It works best on Nifty 5 Minutes , 15 Minutes, 1 Hour, Daily, Weekly and Monthly Time Frames.
It provides easy to visualize multiple information:
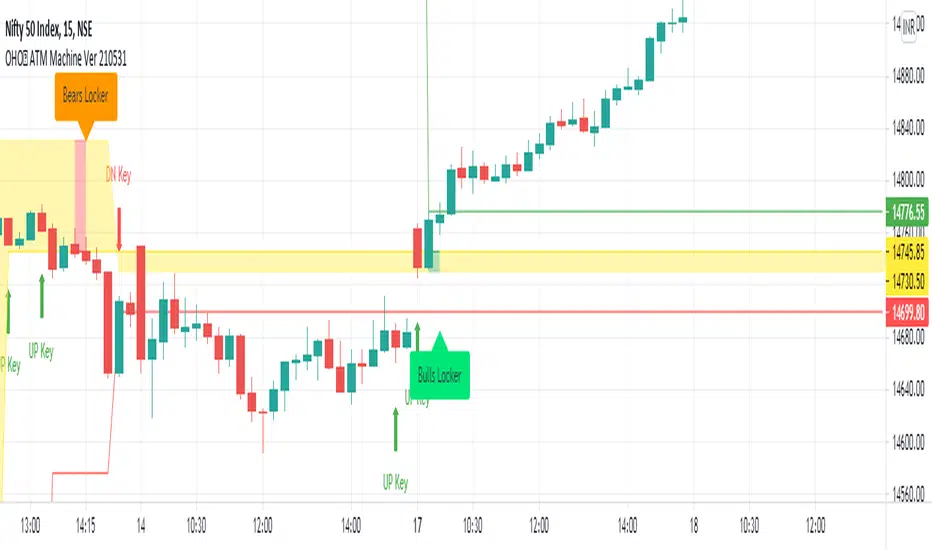
1) It gives the correct Entry on Time. Yellow ATM Area, Means No Trade.
2) Fake Signals are shown when There is Sell Signal and Below is ATM Area.
3) Fake Signals are shown when There is Buy Signal and Above is ATM Area.
4) It gives proper Target at the time of Entry.
5) Stop Loss is Hit when The Candle Closes below ATM Area in Buying and vice versa.
6) No Trade is Recommended, when ATM Area is Yellow.
How to read OHO ATM Machine Indicator?
Buy - When ATM Area is Turned Green in Color First Time after Last Red.
Sell - When ATM Area is Turned Red in Color First Time after Last Green.
Stop Loss - When The Candle Closes below ATM Area in Buy Trade and When The Candle Closes above ATM Area in Sell Trade.
Target - Thin Green Line for Buy Trade and Thin Red for Sell Trade.
Trailing SL - We can Trail the Trade, till the Stop Loss is HIT.
Recommendations:
This can be used for Nifty, Bank Nifty, Stocks, Commodities, Bitcoin, Currency and any other tradable instrument.
What time frame should I use?
5 Minutes and 15 Minutes are best time-frames for Intra-day Trades.
15 Minutes and Hourly are best time-frames for Swing Trades.
Hourly and Daily are best time-frames for Short Term Trades.
But you can check different time-frames in Strategy Testing section or as per your requirements.
Disclaimer:
Past performance is not the guarantee of future performance.
For any type of queries kindly send us personal message.
2.) Easy to Find Sell Entry when there is Bears Locker.
3.) Trailing Profit/Stop Loss Line will guide you to maximize the profits and minimize the losses.
4.) Dn Key Means Downside Entry for Risky Players along with given targets.
5.) Up Key Means Upside Entry for Risky Players along with given targets.
6.) Expected Range will give you clear information about the trading range.
7.) Expected Big Moves means trend is expected to be continued.
Script su invito
Solo gli utenti autorizzati dall'autore hanno accesso a questo script e ciò richiede solitamente un pagamento. Puoi aggiungere lo script ai tuoi preferiti, ma potrai utilizzarlo solo dopo aver richiesto l'autorizzazione e averla ottenuta dal suo autore - per saperne di più leggi qui. Per maggiori dettagli, segui le istruzioni dell'autore qui sotto o contatta direttamente AIATMMACHINE.
TradingView NON consiglia di pagare o utilizzare uno script a meno che non ci si fidi pienamente del suo autore e non si comprenda il suo funzionamento. Puoi anche trovare alternative gratuite e open-source nei nostri script della comunità.
Istruzioni dell'autore
Attenzione: prima di richiedere l'accesso, leggi la nostra guida per gli script su invito.
Declinazione di responsabilità
Script su invito
Solo gli utenti autorizzati dall'autore hanno accesso a questo script e ciò richiede solitamente un pagamento. Puoi aggiungere lo script ai tuoi preferiti, ma potrai utilizzarlo solo dopo aver richiesto l'autorizzazione e averla ottenuta dal suo autore - per saperne di più leggi qui. Per maggiori dettagli, segui le istruzioni dell'autore qui sotto o contatta direttamente AIATMMACHINE.
TradingView NON consiglia di pagare o utilizzare uno script a meno che non ci si fidi pienamente del suo autore e non si comprenda il suo funzionamento. Puoi anche trovare alternative gratuite e open-source nei nostri script della comunità.
Istruzioni dell'autore
Attenzione: prima di richiedere l'accesso, leggi la nostra guida per gli script su invito.