OPEN-SOURCE SCRIPT
SP 500 PE Ratio (Loose Date Match)
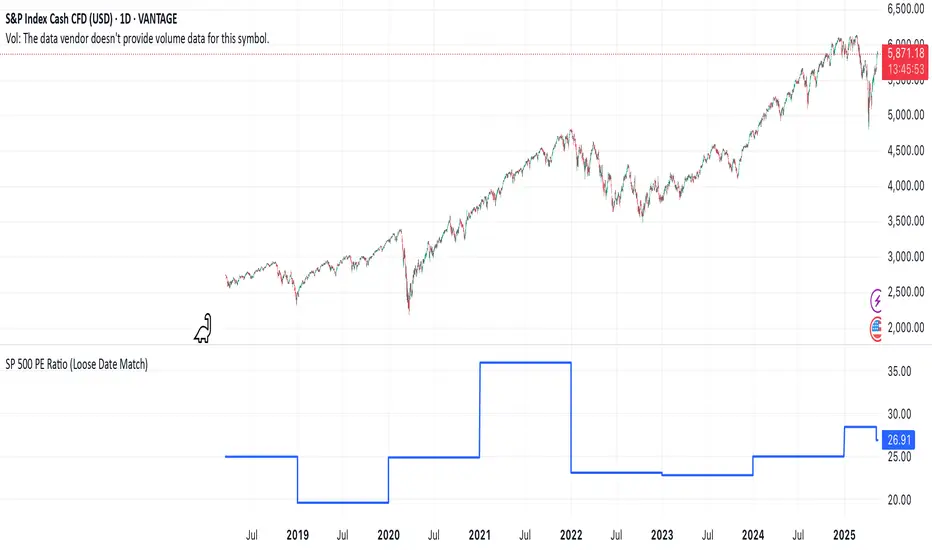
📈 **S&P 500 PE Ratio (from Excel Data)**
This custom indicator visualizes the historical S&P 500 Price-to-Earnings (PE) Ratio loaded from Excel. Each data point represents a snapshot of the market valuation at a specific time, typically on an annual or quarterly basis.
🔹 **What it does:**
- Plots the PE ratio values on the chart aligned with historical dates
- Uses stepwise or linear rendering to account for missing trading days
- Helps identify valuation cycles and extremes (e.g., overvalued vs undervalued)
🔍 **Use case:**
- Long-term market analysis
- Compare PE trends with price performance
- Spot long-term entry/exit zones based on valuation
🛠️ Future plans:
- Add value zone highlighting (e.g., PE > 30 = red, PE < 15 = green)
- Support for dynamic datasets (via Google Sheets or Notion)
Category: `Breadth indicators`, `Cycles`
💡 Source: Manually imported data (can be replaced with any custom macro data series)
Script open-source
Nello spirito di TradingView, l'autore di questo script lo ha reso open source, in modo che i trader possano esaminarne e verificarne la funzionalità. Complimenti all'autore! Sebbene sia possibile utilizzarlo gratuitamente, ricordiamo che la ripubblicazione del codice è soggetta al nostro Regolamento.
Declinazione di responsabilità
Le informazioni e le pubblicazioni non sono intese come, e non costituiscono, consulenza o raccomandazioni finanziarie, di investimento, di trading o di altro tipo fornite o approvate da TradingView. Per ulteriori informazioni, consultare i Termini di utilizzo.