E³ Up-Down Volume % (NASDAQ)
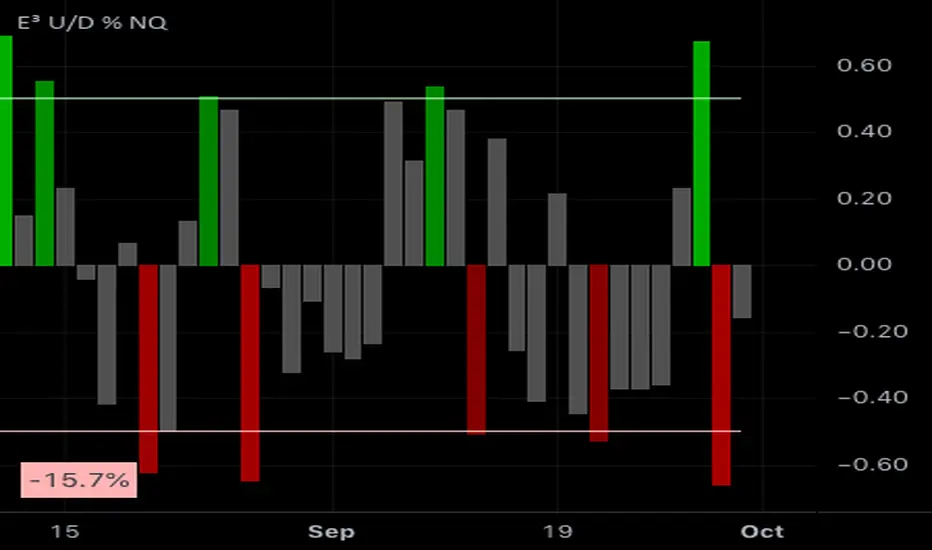
Strong readings correspond to strong days and the differential in volume can often be ascertained from the market open and in the first 5-30 minutes of the market, to give you a sense of how the market might play out that day.
It is especially good at predicting STRONGEST days as well as DOJI days (indecision days).
EXAMPLES:
- A +1% reading would mean that there is 1% more up volume on the day than down volume, meaning it's nearly a DOJI day or indecisive day where up down volume is basically 50/50 and the day is not particularly bullish (or bearish). Same goes for a very low bearish reading such as -1%.
- an 80% BULLISH reading would mean that the day's volume differential is hugely favoring the bullside (buying demand). These days are so strong in sentiment that they usually end up being STRONG BULLISH CONTINUATION candles with little to no topside wick by the end of the day.
- Conversely an 80% bearish candle would mean an intensely strong sell-side volume day.
TECHNICALLY:
90% bullish = 95% of the volume on the day is UP (very rare, ie: once every 2+ years)
80% bullish = 90% of the volume is UP (rare, ie: once or twice a year)
50% bullish = 75% of volume is UP (significant when it occurs, but not uncommon)
0-1% bullish = 50% of volume is up
-50% bearish = 75% of the volume is DOWN
-80% bearish = 90% of the volume is DOWN
-90% bearish = 95% of the volume is DOWN
OPTIMUM SETTINGS = Threshold Percent to 45-55%
This means that roughly 3/4 of the volume transpiring(ed) on the day is either UP or DOWN and will color the histogram if levels are that strong (either bullish or bearish)
Script su invito
Solo gli utenti approvati dall'autore possono accedere a questo script. È necessario richiedere e ottenere l'autorizzazione per utilizzarlo. Tale autorizzazione viene solitamente concessa dopo il pagamento. Per ulteriori dettagli, seguire le istruzioni dell'autore riportate di seguito o contattare direttamente evanevansmusic.
TradingView NON consiglia di pagare o utilizzare uno script a meno che non ci si fidi pienamente del suo autore e non si comprenda il suo funzionamento. Puoi anche trovare alternative gratuite e open-source nei nostri script della comunità.
Istruzioni dell'autore
Attenzione: prima di richiedere l'accesso, leggi la nostra guida per gli script su invito.
Declinazione di responsabilità
Script su invito
Solo gli utenti approvati dall'autore possono accedere a questo script. È necessario richiedere e ottenere l'autorizzazione per utilizzarlo. Tale autorizzazione viene solitamente concessa dopo il pagamento. Per ulteriori dettagli, seguire le istruzioni dell'autore riportate di seguito o contattare direttamente evanevansmusic.
TradingView NON consiglia di pagare o utilizzare uno script a meno che non ci si fidi pienamente del suo autore e non si comprenda il suo funzionamento. Puoi anche trovare alternative gratuite e open-source nei nostri script della comunità.
Istruzioni dell'autore
Attenzione: prima di richiedere l'accesso, leggi la nostra guida per gli script su invito.