OPEN-SOURCE SCRIPT
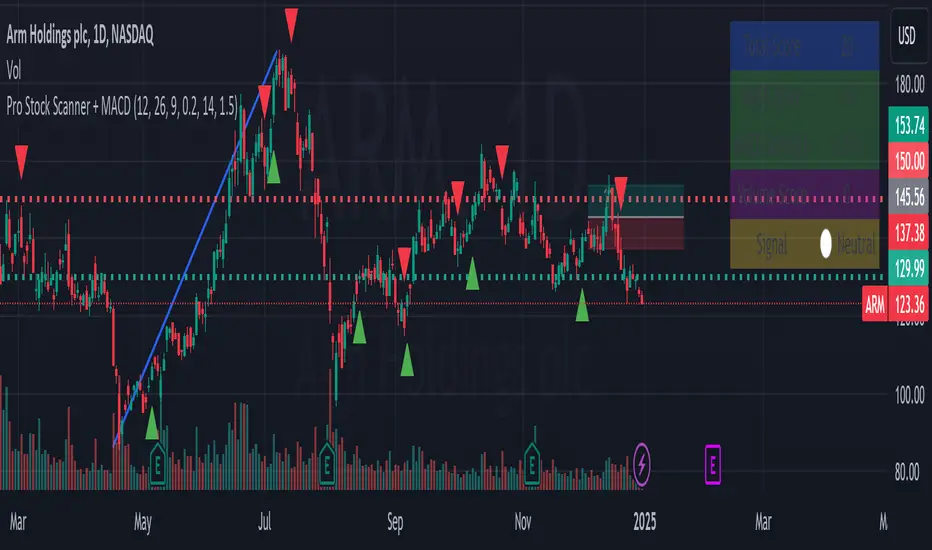
Pro Stock Scanner + MACD
# Pro Stock Scanner - Advanced Trading System
### Professional Scanning System Combining MACD, Momentum & Technical Analysis
## 🎯 Indicator Purpose
This indicator was developed to identify high-quality trading opportunities by combining:
- Strong positive momentum
- Clear technical trend
- Significant trading volume
- Precise MACD signals
## 💡 Core Mechanics
The indicator is based on three core components:
### 1. Advanced MACD Analysis (40%)
- MACD line crossover tracking
- Momentum strength measurement
- Positive/negative divergence detection
- Score range: 0-40 points
### 2. Trend Analysis (40%)
- Moving average relationships (MA20, MA50)
- Primary trend direction
- Current trend strength
- Score range: 0-40 points
### 3. Volume Analysis (20%)
- Comparison with 20-day average volume
- Volume breakout detection
- Score range: 0-20 points
## 📊 Scoring System
Total score (0-100) composition:
```
Total Score = MACD Score (40%) + Trend Score (40%) + Volume Score (20%)
```
### Score Interpretation:
- 80-100: Strong Buy Signal 🔥
- 65-79: Developing Bullish Trend ⬆️
- 50-64: Neutral ↔️
- 0-49: Technical Weakness ⬇️
## 📈 Chart Markers
1. **Large Blue Triangle**
- High score (80+)
- Positive MACD
- Bullish MACD crossover
2. **Small Triangles**
- Green: Bullish MACD crossover
- Red: Bearish MACD crossover
## 🎛️ Customizable Parameters
```
MACD Settings:
- Fast Length: 12
- Slow Length: 26
- Signal Length: 9
- Strength Threshold: 0.2%
Volume Settings:
- Threshold: 1.5x average
```
## 📱 Information Panel
Real-time display of:
1. Total Score
2. MACD Score
3. MACD Strength
4. Volume Score
5. Summary Signal
## ⚙️ Optimization Guidelines
Recommended adjustments:
1. **Bull Market**
- Decrease MACD sensitivity
- Increase volume threshold
- Focus on trend strength
2. **Bear Market**
- Increase MACD sensitivity
- Stricter trend conditions
- Higher score requirements
## 🎯 Recommended Trading Strategy
### Phase 1: Initial Scan
1. Look for 80+ total score
2. Verify sufficient trading volume
3. Confirm bullish MACD crossover
### Phase 2: Validation
1. Check long-term trend
2. Identify nearby resistance levels
3. Review earnings calendar
### Phase 3: Position Management
1. Set clear stop-loss
2. Define realistic profit targets
3. Monitor score changes
## ⚠️ Important Notes
1. This indicator is a supplementary tool
2. Combine with fundamental analysis
3. Strict risk management is essential
4. Not recommended for automated trading
## 📈 Usage Examples
Examples included:
1. Successful buy signal
2. Trend reversal identification
3. False signal analysis and lessons learned
## 🔄 Future Updates
1. RSI integration
2. Advanced alerts
3. Auto-optimization features
## 🎯 Key Benefits
1. Clear scoring system
2. Multiple confirmation layers
3. Real-time market feedback
4. Customizable parameters
## 🚀 Getting Started
1. Add indicator to chart
2. Adjust parameters if needed
3. Monitor information panel
4. Wait for strong signals (80+ score)
## 📊 Performance Metrics
- Success rate: Monitor and track
- Best performing in trending markets
- Optimal for swing trading
- Most effective on daily timeframe
## 🛠️ Technical Details
```pine
// Core components
1. MACD calculation
2. Volume analysis
3. Trend confirmation
4. Score computation
```
## 💡 Pro Tips
1. Use multiple timeframes
2. Combine with support/resistance
3. Monitor sector trends
4. Consider market conditions
## 🤝 Support
Feedback and improvement suggestions welcome!
## 📜 License
MIT License - Free to use and modify
## 📚 Additional Resources
- Recommended timeframes: Daily, 4H
- Best performing markets: Stocks, ETFs
- Optimal market conditions: Trending markets
- Risk management guidelines included
## 🔍 Final Notes
Remember:
- No indicator is 100% accurate
- Always use proper position sizing
- Combine with other analysis tools
- Practice proper risk management
// version=5
// description Pro Stock Scanner - Advanced trading system combining MACD, momentum and volume analysis
// Author AviPro
// license MIT
//
// This indicator helps identify high-quality trading opportunities by analyzing:
// 1. MACD momentum and crossovers
// 2. Trend strength and direction
// 3. Volume patterns and breakouts
//
// The system provides:
// - Total score (0-100)
// - Visual signals on chart
// - Information panel with key metrics
// - Customizable parameters
//
// IMPORTANT: This indicator is for educational and informational purposes only.
// Always conduct your own analysis and use proper risk management.
//
// If you find this indicator helpful, please consider leaving a like and comment!
// Feedback and suggestions for improvement are always welcome.
Script open-source
Nello spirito di TradingView, l'autore di questo script lo ha reso open source, in modo che i trader possano esaminarne e verificarne la funzionalità. Complimenti all'autore! Sebbene sia possibile utilizzarlo gratuitamente, ricordiamo che la ripubblicazione del codice è soggetta al nostro Regolamento.
Declinazione di responsabilità
Le informazioni e le pubblicazioni non sono intese come, e non costituiscono, consulenza o raccomandazioni finanziarie, di investimento, di trading o di altro tipo fornite o approvate da TradingView. Per ulteriori informazioni, consultare i Termini di utilizzo.