OPEN-SOURCE SCRIPT
Aggiornato TFEX_INDICATOR_SET13
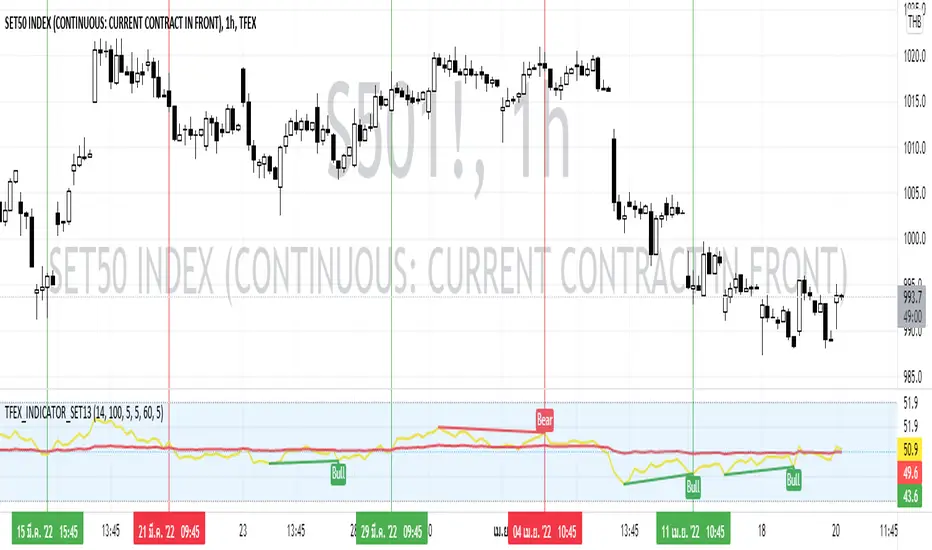
This Indicator use the calculated RSI of the top 13 stocks that have the highest market capitalization in  SET50 where suitable for TFEX trading(
 S501!).
Conducted with 2 RSI period as follow:
How to use:
1) Use this Indicator by Crossover
2) Use this Indicator by Divergence of RSI Main
3) The combination of Divergence and Crossover
Preferred Timeframe
Conducted with 2 RSI period as follow:
- RSI Main (14)
- RSI Average (100)
How to use:
1) Use this Indicator by Crossover
- If the RSI Main Cross UP the RSI Average can assume as BUY SIGNAL
- If the RSI Main Cross DOWN the RSI Average can assume as SELL SIGNAL
2) Use this Indicator by Divergence of RSI Main
- If the RSI Main got any Regular Bullish or Hidden Bullish can assume as BUY SIGNAL
- If the RSI Main got any Regular Bearish or Hidden Bearish can assume as SELL SIGNAL
3) The combination of Divergence and Crossover
- If the RSI Main got any Regular Bullish or Hidden Bullish then pending for the RSI Main Cross UP the RSI Average which can assume as BUY SIGNAL
- If the RSI Main got any Regular Bearish or Hidden Bearish then pending for the RSI Main Cross DOWN the RSI Average which can assume as SELL SIGNAL
Preferred Timeframe
- 4H
- 2H
- 1H
Note di rilascio
Update name of the RSI appearance settingNote di rilascio
Add Alert ConditionsNote di rilascio
Change Calculation from SCB to EA as SCB delisted in SETNote di rilascio
Update Alert condition to have Overbought and OversoldEdit last description: Change Calculation from SCB to CPN as SCB delisted in SET
Note di rilascio
Update ChartNote di rilascio
Update NEW SET13 List- AOT
- PTT
- DELTA
- PTTEP
- BCP
- CPALL
- KBANK
- DTAC
- BBL
- BDMS
- ESSO
- KTB
- GULF
Note di rilascio
Update new stock listScript open-source
Nello spirito di TradingView, l'autore di questo script lo ha reso open source, in modo che i trader possano esaminarne e verificarne la funzionalità. Complimenti all'autore! Sebbene sia possibile utilizzarlo gratuitamente, ricordiamo che la ripubblicazione del codice è soggetta al nostro Regolamento.
Declinazione di responsabilità
Le informazioni e le pubblicazioni non sono intese come, e non costituiscono, consulenza o raccomandazioni finanziarie, di investimento, di trading o di altro tipo fornite o approvate da TradingView. Per ulteriori informazioni, consultare i Termini di utilizzo.
Script open-source
Nello spirito di TradingView, l'autore di questo script lo ha reso open source, in modo che i trader possano esaminarne e verificarne la funzionalità. Complimenti all'autore! Sebbene sia possibile utilizzarlo gratuitamente, ricordiamo che la ripubblicazione del codice è soggetta al nostro Regolamento.
Declinazione di responsabilità
Le informazioni e le pubblicazioni non sono intese come, e non costituiscono, consulenza o raccomandazioni finanziarie, di investimento, di trading o di altro tipo fornite o approvate da TradingView. Per ulteriori informazioni, consultare i Termini di utilizzo.