OPEN-SOURCE SCRIPT
Aggiornato Sweep + MSS

# Sweep + MSS Indicator
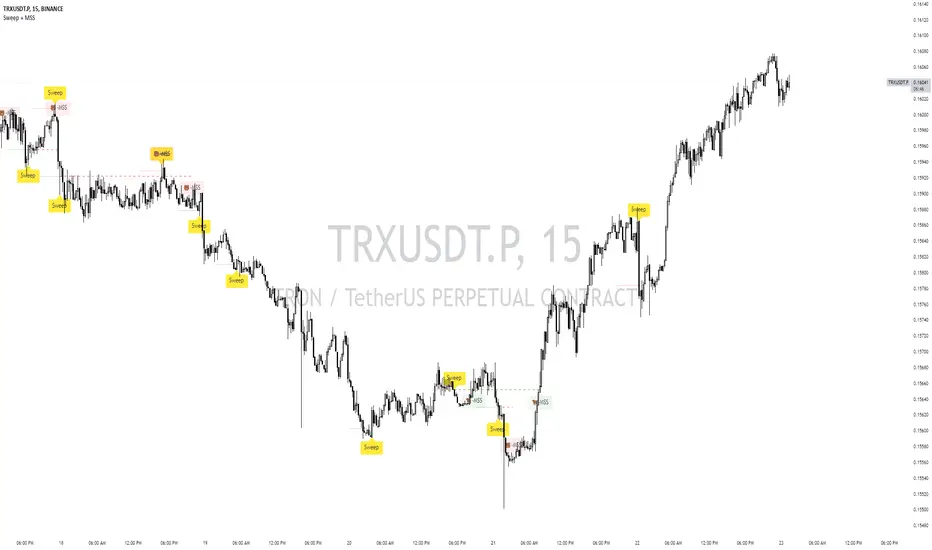
This indicator identifies market sweeps and Market Structure Shifts (MSS) to help traders recognize potential trend changes and market manipulations.
How it works:
1. Sweep Detection:
- Identifies when price briefly moves beyond a recent high/low (pivot point) and then reverses.
- Bullish sweep: Price drops below a recent low, then closes above it.
- Bearish sweep: Price rises above a recent high, then closes below it.
2. Market Structure Shift (MSS):
- Occurs when price action invalidates a previous sweep level.
- Bullish MSS: Price closes above a bearish sweep level.
- Bearish MSS: Price closes below a bullish sweep level.
Key Features:
- Customizable pivot lookback length for sweep detection
- Minimum bar requirement after a sweep before MSS can trigger
- One MSS per sweep level to avoid multiple signals
- Visual representation with lines connecting sweep points to MSS triggers
- Emoji labels for easy identification (🐂-MSS for bullish, 🐻-MSS for bearish)
Logic Behind MSS:
The MSS aims to identify potential trend changes by recognizing when the market invalidates a previous sweep level. This often indicates a shift in market structure, suggesting that the previous trend may be weakening or reversing.
- A bullish MSS occurs when the price closes above a bearish sweep level, potentially signaling a shift from bearish to bullish sentiment.
- A bearish MSS occurs when the price closes below a bullish sweep level, potentially signaling a shift from bullish to bearish sentiment.
By requiring a minimum number of bars between the sweep and the MSS, the indicator helps filter out noise and focuses on more significant structural changes in the market.
This indicator can be a valuable tool for traders looking to identify potential trend changes and entry/exit points based on market structure analysis.
Note di rilascio
- Added New Filters- Upgraded Pine Version
Script open-source
Nello spirito di TradingView, l'autore di questo script lo ha reso open source, in modo che i trader possano esaminarne e verificarne la funzionalità. Complimenti all'autore! Sebbene sia possibile utilizzarlo gratuitamente, ricordiamo che la ripubblicazione del codice è soggetta al nostro Regolamento.
Declinazione di responsabilità
Le informazioni e le pubblicazioni non sono intese come, e non costituiscono, consulenza o raccomandazioni finanziarie, di investimento, di trading o di altro tipo fornite o approvate da TradingView. Per ulteriori informazioni, consultare i Termini di utilizzo.