OPEN-SOURCE SCRIPT
Multi Timeframe Moving Averages
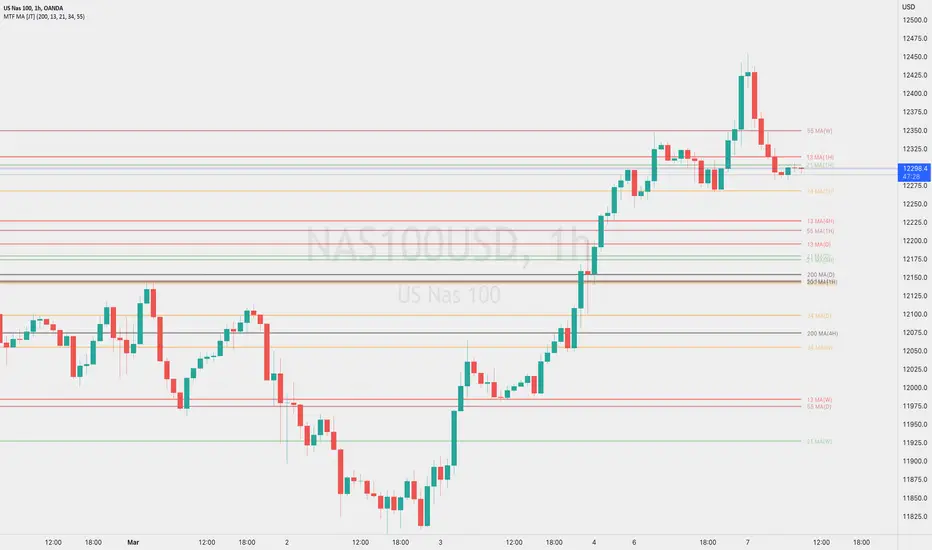
This indicator is designed to help traders analyze market trends by displaying five exponential moving averages (EMA) of their choice across four fixed intervals: weekly, daily, 4-hourly, and hourly.
The user can choose which moving averages and intervals to display, and can enable or disable these options as needed. The moving averages are drawn as lines and are updated in real-time based on the current EMA values in the respective intervals.
This indicator can help traders identify potential areas of support and resistance, as well as identify trends in the market. By displaying multiple EMAs across multiple time intervals, traders can get a more complete picture of the market and make more informed trading decisions.
Script open-source
Nello spirito di TradingView, l'autore di questo script lo ha reso open source, in modo che i trader possano esaminarne e verificarne la funzionalità. Complimenti all'autore! Sebbene sia possibile utilizzarlo gratuitamente, ricordiamo che la ripubblicazione del codice è soggetta al nostro Regolamento.
Declinazione di responsabilità
Le informazioni e le pubblicazioni non sono intese come, e non costituiscono, consulenza o raccomandazioni finanziarie, di investimento, di trading o di altro tipo fornite o approvate da TradingView. Per ulteriori informazioni, consultare i Termini di utilizzo.