PROTECTED SOURCE SCRIPT
Aggiornato BTFD 5 Break-Out indy
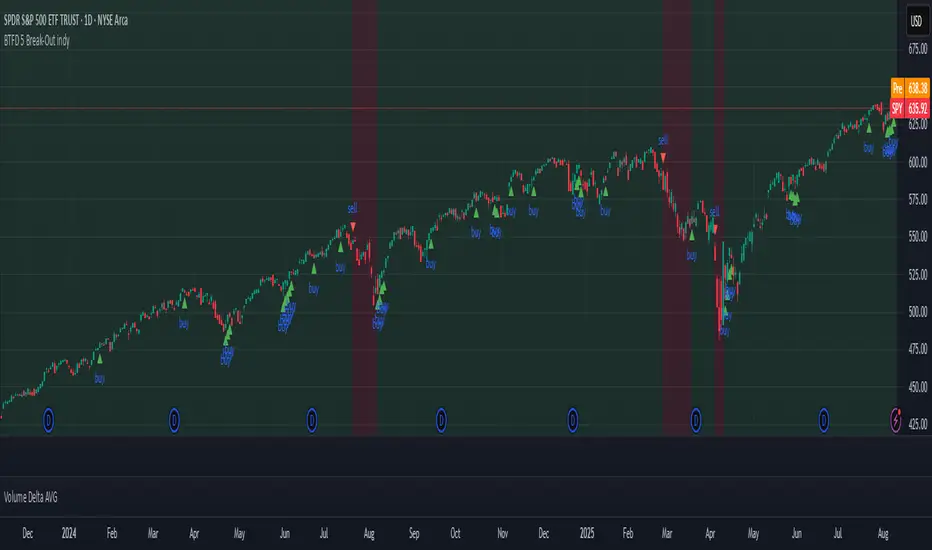
The "BTFD 5 Break-Out indy" indicator uses background colors and buy/sell triangles to visually represent trading signals and position status based on its logic. Here's a brief explanation of the logic behind the green/red background and buy/sell triangles:
- **Green/Red Background**:
- **Green Background**: Displayed when the indicator is in a "long" position, meaning a buy signal has been triggered and the position is active. This indicates the market is in a favorable state for holding a long trade, based on conditions like an oversold breakout or strong momentum.
- **Red Background**: Shown when not in a long position, either before entering a trade or after exiting due to a sell signal (e.g., trend reversal, overbought conditions, or stop-loss hit). It signals a neutral or unfavorable state for buying.
- **Buy/Sell Triangles**:
- **Buy Triangles (Green, Below Bar)**: Plotted when a buy signal is triggered, indicating a high-probability entry point. This occurs when the market shows signs of recovery from an oversold state (e.g., a significant upward shift in the smoothed Z-score) or strong momentum (e.g., a rapid change in the rate-of-change metric). The triangle marks the exact bar where the long position is initiated.
- **Sell Triangles (Red, Above Bar)**: Plotted when an exit condition is met, signaling the close of a long position. Exits are triggered by a trend reversal (e.g., a trailing moving average turning bearish), a shift to overbought conditions, or a stop-loss breach. The triangle marks the bar where the position is closed.
In summary, the green background reflects an active long trade, while red indicates no position. Buy triangles signal entry points based on oversold breakouts or momentum, and sell triangles mark exits due to trend changes, reversals, or losses, aligning with institutional dip-buying strategies.
Note di rilascio
updated some visualsScript protetto
Questo script è pubblicato come codice protetto. Tuttavia, è possibile utilizzarle liberamente e senza alcuna limitazione – ulteriori informazioni qui.
Declinazione di responsabilità
Le informazioni e le pubblicazioni non sono intese come, e non costituiscono, consulenza o raccomandazioni finanziarie, di investimento, di trading o di altro tipo fornite o approvate da TradingView. Per ulteriori informazioni, consultare i Termini di utilizzo.
Script protetto
Questo script è pubblicato come codice protetto. Tuttavia, è possibile utilizzarle liberamente e senza alcuna limitazione – ulteriori informazioni qui.
Declinazione di responsabilità
Le informazioni e le pubblicazioni non sono intese come, e non costituiscono, consulenza o raccomandazioni finanziarie, di investimento, di trading o di altro tipo fornite o approvate da TradingView. Per ulteriori informazioni, consultare i Termini di utilizzo.