OPEN-SOURCE SCRIPT
Glitch Index
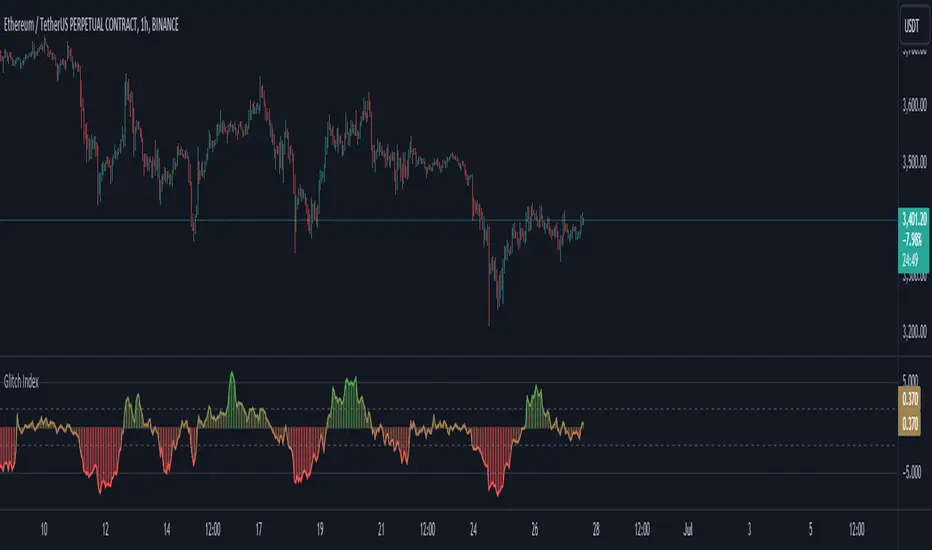
Glitch Index is an oscillator from an unknown origin that is discovered in 2013 as a lua indicator taken from MetaStock days and we are not really sure how far back the original idea goes.
How it Works?
As I found this indicator and looking at it's code in different platform I can see it comes back from a basic idea of getting a price value, calculating it's smoothed average with a set multiplier and getting the difference then presenting it on a simplified scale. It appears to be another interpretation of figuring out price acceleration and velocity. The main logic is calculated as below:
Pine Script®
How to Use?
Glitch Index can be used based on different implementations and along with your already existing trading system as a confirmation. Yoıu can use it as a Long signal when the histogram crosses inner levels or you can use it as an overbough and oversold signals when the histogram crosses above outter levels and gets back in the range between outter and inner levels.
You can customise the settings and set your prefered inner and outter levels in indicator settings along with gradient or static based coloring and modify the code as you see fit. The coloring code is set below:
Pine Script®
How it Works?
As I found this indicator and looking at it's code in different platform I can see it comes back from a basic idea of getting a price value, calculating it's smoothed average with a set multiplier and getting the difference then presenting it on a simplified scale. It appears to be another interpretation of figuring out price acceleration and velocity. The main logic is calculated as below:
price = priceSet(priceType)
_ma = getAverageName(price, MaMethod, MaPeriod)
rocma = ((_ma - _ma[1]) * 0.1) + 1
maMul = _ma * rocma
diff = price - maMul
gli_ind = (diff / price) * -10
How to Use?
Glitch Index can be used based on different implementations and along with your already existing trading system as a confirmation. Yoıu can use it as a Long signal when the histogram crosses inner levels or you can use it as an overbough and oversold signals when the histogram crosses above outter levels and gets back in the range between outter and inner levels.
You can customise the settings and set your prefered inner and outter levels in indicator settings along with gradient or static based coloring and modify the code as you see fit. The coloring code is set below:
gli_col = gli_ind > outterLevel ? color.green : gli_ind < -outterLevel ? color.red : gli_ind > innerLevel ? color.rgb(106, 185, 109, 57) : gli_ind < -innerLevel ? color.rgb(233, 111, 111, 40) : color.new(color.yellow, 60)
gradcol = color.from_gradient(gli_ind, -outterLevel, outterLevel, color.red, color.green)
colorSelect = colorType == "Gradient" ? gradcol : gli_col
Script open-source
Nello spirito di TradingView, l'autore di questo script lo ha reso open source, in modo che i trader possano esaminarne e verificarne la funzionalità. Complimenti all'autore! Sebbene sia possibile utilizzarlo gratuitamente, ricordiamo che la ripubblicazione del codice è soggetta al nostro Regolamento.
One does not simply win every trade.
Declinazione di responsabilità
Le informazioni e le pubblicazioni non sono intese come, e non costituiscono, consulenza o raccomandazioni finanziarie, di investimento, di trading o di altro tipo fornite o approvate da TradingView. Per ulteriori informazioni, consultare i Termini di utilizzo.