OPEN-SOURCE SCRIPT
Indicator Visualizer V1.0
This is a script so that you can visualize crossover/under indicators on the chart as zones/boxes or as lines.
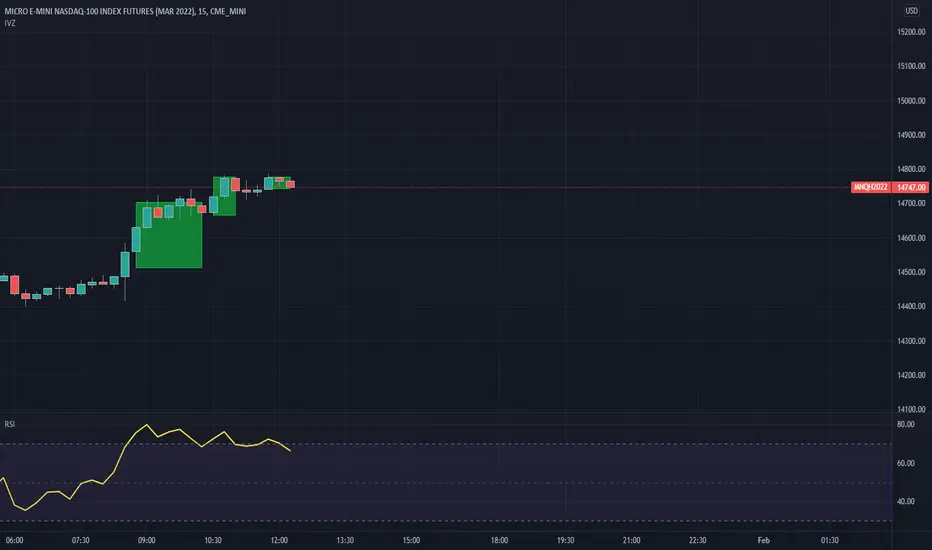
By default the source is "Close". When the source is Close and the default RSI is checked, then the indicator will visualize crossover and under from a 14 period RSI as shown in the published chart.
How this indicator works:
Add the indicator you want to visualize to the chart, and this indicator.
Open this indicator and set the source to the indicator you want to visualize, then set the levels you want to visualize the crossovers for.
Using the default as an example [RSI 14-Crossover-70]
When the RSI crosses above level 1 (default 70) then it will begin plotting a "Cross Over" box.
Each bar that the RSI remains above level 1 it will adjust the top of the box and the right side of the box.
When RSI crosses back below level 1 then the box will stop adjusting and end on that bar.
Using the default as an example [RSI 14-Crossunder-30]
When the RSI crosses below level 2 (default 30) then it will begin plotting a "Cross Under" box.
Each bar that the RSI remains below level 2 it will adjust the bottom of the box and the right side of the box.
When RSI crosses back above level 2 then the box will stop adjusting and end on that bar.
If you want to use lines they will be drawn from the close of the starting bar to the close of the current/end bar.
You are able to set an extension for the lines if you would like them to extend a specific amount past the close bar. (I.E. 1,2,or 3 bars)
If you wish to use the source as close, then you must uncheck the Default RSI box.
Script open-source
Nello spirito di TradingView, l'autore di questo script lo ha reso open source, in modo che i trader possano esaminarne e verificarne la funzionalità. Complimenti all'autore! Sebbene sia possibile utilizzarlo gratuitamente, ricordiamo che la ripubblicazione del codice è soggetta al nostro Regolamento.
Declinazione di responsabilità
Le informazioni e le pubblicazioni non sono intese come, e non costituiscono, consulenza o raccomandazioni finanziarie, di investimento, di trading o di altro tipo fornite o approvate da TradingView. Per ulteriori informazioni, consultare i Termini di utilizzo.