OPEN-SOURCE SCRIPT
Strength Momentum Indicator
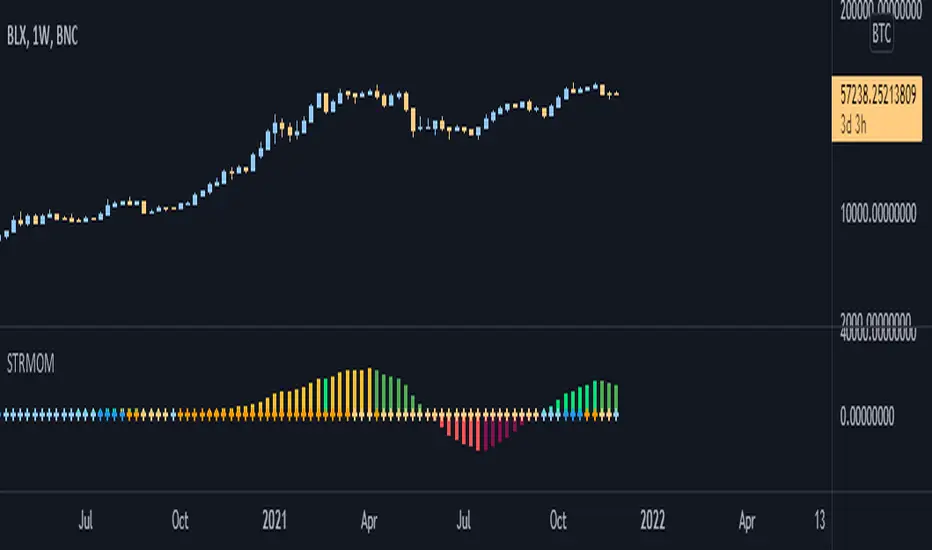
This indicator is a fork of https://www.tradingview.com/script/nqQ1DT5a-Squeeze-Momentum-Indicator-LazyBear/. It takes it a step further by including RSI and ADX information, which are represented in this indicator as follows:
Almost all of the normally adjustable values can be adjusted in the settings for each of the base indicators. Also adjustable:
- MOM: The histogram itself is a linear regression curve, by default for the study period the Fibonacci series and exponential moving average were used. You can adjust the settings to your liking.
- RSI: Whenever the RSI is outside the normal ranges (which you can adjust in the settings), the bar in the histogram will turn amber to warn you.
- ADX: Crosses are drawn along the 0 line to indicate the ADX . Blue means that the ADX is below the trend level (adjustable in the settings), and orange means that it is above that level. Darker colors indicate that the ADX has risen from the previous bar, while lighter colors indicate that it has fallen.
Almost all of the normally adjustable values can be adjusted in the settings for each of the base indicators. Also adjustable:
- The RSI alert levels (30 and 70 by default).
- The ADX crossover, i.e. the point at which the ADX value is considered to indicate a strong trend (25 by default).
- All colors, naturally.
Script open-source
Nello spirito di TradingView, l'autore di questo script lo ha reso open source, in modo che i trader possano esaminarne e verificarne la funzionalità. Complimenti all'autore! Sebbene sia possibile utilizzarlo gratuitamente, ricordiamo che la ripubblicazione del codice è soggetta al nostro Regolamento.
Declinazione di responsabilità
Le informazioni e le pubblicazioni non sono intese come, e non costituiscono, consulenza o raccomandazioni finanziarie, di investimento, di trading o di altro tipo fornite o approvate da TradingView. Per ulteriori informazioni, consultare i Termini di utilizzo.