Fundur - Trend Trader
Indicator Overview
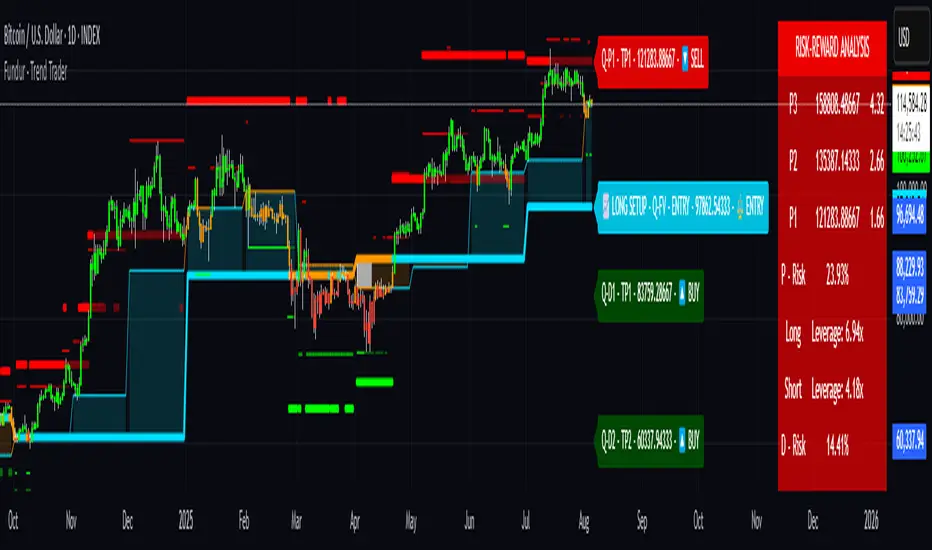
The Fundur - Trend Trader is a comprehensive dual-timeframe analysis indicator that combines fair value structure analysis, risk-reward calculations, and dynamic trend identification into one powerful trading tool. This indicator is designed to provide traders with precise entry and exit points while offering complete risk management insights.
What Makes Trend Trader Unique?
The Trend Trader goes beyond traditional pivot point indicators by introducing Fair Value Structure Analysis - a methodology that analyzes the relationship between two timeframes to determine market bias and optimal trading opportunities. Unlike static indicators, Trend Trader provides dynamic analysis that adapts to market conditions in real-time.
Core Methodology
The indicator operates on the principle that markets oscillate between Premium (overvalued) and Discount (undervalued) zones relative to fair value levels. By analyzing these zones across multiple timeframes, traders can identify high-probability trade setups with clearly defined risk-reward parameters.
Key Features
🎯 Dual-Timeframe Fair Value Analysis
- Higher Timeframe Structure: Primary trend direction and major levels
- Lower Timeframe Structure: Refined entry opportunities and micro-trend analysis
- Dynamic Relationship: Real-time analysis of timeframe alignment
📊 Comprehensive Level System
- Fair Value (FV): Central equilibrium level for entries
- Premium Levels (P1, P2, P3): Sell zones with increasing distance from fair value
- Discount Levels (D1, D2, D3): Buy zones with increasing distance from fair value
🧠 Intelligent Trend Detection
- Session-to-Session Analysis: Compares current vs previous session fair values
- Trend Signals: Clear LONG/SHORT setup identification
- Structure Bias: Bullish/Bearish fair value structure determination
⚖️ Advanced Risk-Reward System
- Real-Time R:R Calculations: Dynamic risk-reward ratios for all levels
- Leverage Recommendations: Optimal position sizing based on measured risk
- Risk Percentage Display: Precise risk calculations for informed decisions
🎨 Smart Visual Features
- Level Hit Tracking: Automatically darkens touched levels during session
- Squeeze Detection: Identifies low-volatility periods with special bar coloring
- Dynamic Highlighting: Price-responsive level emphasis
- Zone Fills: Visual premium and discount area identification
Setup Guide
Step 1: Adding the Indicator
- Open TradingView and navigate to your desired chart
- Click the "Indicators" button or press "/" key
- Search for "Fundur - Trend Trader"
- Add the indicator to your chart
Step 2: Basic Configuration
Timeframe Settings
Higher Timeframe: Default is Weekly (W), adjust based on your trading style:
- Scalping: Use 4H for higher timeframe
- Day Trading: Use Daily (D) for higher timeframe
- Short-Term Swing Trading: Use Weekly (W) for higher timeframe
- Long-Term Swing Trading: Use Monthly (M) for higher timeframe
- Position Trading: Use Quarterly (3M) or Yearly (12M) for higher timeframe
History Bars:
- Higher Timeframe: 10 bars (recommended)
- Lower Timeframe: 50 bars (recommended)
Visual Settings
- Line Widths: Adjust for visibility preference
- Zone Fills: Enable for better visual zone identification
- Bar Coloring: Enable structure and squeeze coloring
Step 3: Label Configuration
Essential Labels (Recommended Settings)
✅ Show All Labels: ON
✅ Show Trend Direction: ON
✅ Show Higher Timeframe Labels: ON
⚠️ Show Lower Timeframe Labels: OFF (avoid clutter initially)
✅ Show Price Values: ON
Label Style Options
- Use Short Names: ON (P1, D2, FV instead of full names)
- Combine Timeframe & Description: ON (creates compact labels like "W-FV")
- Label Style: Choose between Modern or Classic
Step 4: Risk-Reward Setup
✅ Show Risk-Reward Analysis: ON
✅ Show Measured Risk Values: ON
✅ Apply Leverage to Calculations: ON
Leverage Multiplier: Start with 1.0, adjust based on your risk tolerance
Basic Trading Guide
Understanding Fair Value Structure
The indicator's foundation is the Fair Value Structure - the relationship between higher and lower timeframe fair value levels:
Bullish Structure (🔵)
- Condition: Lower timeframe FV above higher timeframe FV
- Bias: Look for LONG opportunities
- Focus: Fair Value Structure for entries (continuation strategy)
- Strategy: Enter long positions at Fair Value, take profits at Premium levels (P1, P2, P3)
Bearish Structure (🟠)
- Condition: Lower timeframe FV below higher timeframe FV
- Bias: Look for SHORT opportunities
- Focus: Fair Value Structure for entries (continuation strategy)
- Strategy: Enter short positions at Fair Value, take profits at Discount levels (D1, D2, D3)
Entry Strategies
Primary Strategy: Fair Value Continuation Entries
- Setup: Price approaches fair value level with established structure bias
- Entry: In Fair Value Structure (in between the lower timeframe and higher timeframe fair value)
- Direction: Follow the structure bias (long in bullish structure, short in bearish structure)
Stop Loss: Two approaches available:
- Advanced Method: Place stop shy of liquidation point to avoid liquidation
- Hassle-Free Method: Previous high/low OR just beyond higher timeframe Fair Value
- For Long Positions: Stop below higher timeframe Fair Value
- For Short Positions: Stop above higher timeframe Fair Value
Profit Taking Strategy:
For Long Positions (Bullish Structure):
- 75% profits at Premium 1 (P1) - highest probability target
- 50% of remaining position at Premium 2 (P2)
- Close entire position at Premium 3 (P3)
- Move stop loss to break even after first profits
For Short Positions (Bearish Structure):
- 75% profits at Discount 1 (D1) - highest probability target
- 50% of remaining position at Discount 2 (D2)
- Close entire position at Discount 3 (D3)
- Move stop loss to break even after first profits
Alternative Strategy: Structure Transition Entries
- Setup: Structure changes from bearish to bullish (or vice versa)
- Entry: At new fair value level after structure confirmation
- Risk Management: Tight stops during structure transition periods
- Targets: Follow primary profit-taking methodology above
Risk Management Framework
Position Sizing Using Leverage Recommendations
The indicator calculates optimal leverage based on measured risk:
- Conservative: Use 50% of recommended leverage
- Moderate: Use 75% of recommended leverage
- Aggressive: Use 100% of recommended leverage
- Never exceed: 150% of recommended leverage
Stop Loss Placement
Follow the methodology outlined in the Primary Strategy section:
- Advanced Method: Place stop shy of liquidation point to avoid forced liquidation
- Hassle-Free Method: Use structural levels for clear invalidation
- Long Positions: Stop below higher timeframe Fair Value
- Short Positions: Stop above higher timeframe Fair Value
- Alternative: Previous significant high/low levels
Analysis Setups
Setup 1: Scalping Configuration (1-5 minute charts)
Timeframe Settings:
- Higher Timeframe: 4H (240)
- Lower Timeframe: 1H (auto-calculated)
- History: 5 bars for higher, 20 bars for lower
Visual Settings:
- Enable all visual features for quick decision making
- Use Classic label style for cleaner appearance
- Enable squeeze coloring for volatility awareness
Trading Approach:
- Focus on fair value continuation entries
- Quick entries in fair value structure
- Tight risk management using R:R table
- Target P1/D1 levels for primary profits (75% position)
Setup 2: Day Trading Configuration (5-15 minute charts)
Timeframe Settings:
- Higher Timeframe: Daily (D)
- Lower Timeframe: 4H (auto-calculated)
- History: 10 bars for higher, 30 bars for lower
Visual Settings:
- Enable zone fills for clear premium/discount identification
- Show both timeframe labels
- Enable level hit tracking
Trading Approach:
- Use structure bias for directional bias
- Enter in fair value structure for continuation trades
- 75% profits at P1/D1, scale out to P2/D2, close at P3/D3
- Hold positions across multiple sessions following structure
Setup 3: Short-Term Swing Trading Configuration (1-4 hour charts)
Timeframe Settings:
- Higher Timeframe: Weekly (W)
- Lower Timeframe: Daily (auto-calculated)
- History: 15 bars for higher, 50 bars for lower
Visual Settings:
- Emphasize higher timeframe levels
- Show trend direction signals
- Enable complete risk-reward analysis
Trading Approach:
- Primary focus on higher timeframe structure
- Patient entries in fair value structure
- Follow standard profit-taking: 75% at P1/D1, scale to P3/D3
- Use lower timeframe for refined fair value entries
Setup 4: Long-Term Swing Trading Configuration (4H charts)
Timeframe Settings:
- Higher Timeframe: Monthly (M)
- Lower Timeframe: Weekly (auto-calculated)
- History: 20 bars for higher, 75 bars for lower
Visual Settings:
- Clean label setup focusing on major levels
- Enable trend direction for bias confirmation
- Simplified visual approach for clarity
Trading Approach:
- Monthly structure provides major trend direction
- Entries in fair value structure
- Hold positions for several weeks
- Apply standard profit-taking methodology at premium/discount zones
Setup 5: Position Trading Configuration (Daily/Weekly charts)
Timeframe Settings:
- Higher Timeframe: Quarterly (3M) or Yearly (12M)
- Lower Timeframe: Monthly or Quarterly (auto-calculated)
- History: 25 bars for higher, 100 bars for lower
Visual Settings:
- Clean label setup focusing on key levels
- Enable all alert systems
- Simplified color scheme
Trading Approach:
- Structure changes signal major macro trend shifts
- Very patient entries in fair value structure confirmation
- Long-term continuation trades targeting extended premium/discount levels
- Hold positions for months to years following structure bias
- Focus on major market cycles and long-term trend continuations
Setup 6: Multi-Asset Analysis Configuration
For Forex Pairs:
- Adjust decimal precision for pip accuracy
- Focus on daily/weekly structure
- Use tight risk management due to leverage
For Crypto Assets:
- Higher volatility requires wider stops
- 24/7 markets need continuous monitoring
- Structure breaks often lead to extended moves
For Stock Indices:
- Respect market hours for structure analysis
- Economic events can override technical levels
- Seasonal patterns affect structure behavior
Visual Components
Level Indicators
- Solid Lines: Active levels based on current price position
- Highlighted Levels: Levels within current price range
- Darkened Levels: Previously touched levels during current session
Zone Fills
- Red Zones: Premium areas (selling opportunities)
- Green Zones: Discount areas (buying opportunities)
- Cloud Fill: Area between dual timeframe fair values
Bar Coloring
- Purple Bars: Squeeze conditions (low volatility)
- Structure Colors: Based on price position relative to fair value levels
Labels and Information
- Level Labels: Price values and targets for each level
- Trend Signals: Clear LONG/SHORT setup indications
- Risk-Reward Table: Comprehensive analysis panel
Risk Management
Built-in Risk Controls
Measured Risk System
The indicator automatically calculates risk percentages based on:
- Distance from fair value to premium/discount levels
- Current price position
- Leverage settings applied
Optimal Leverage Calculations
- Long Positions: Based on discount risk measurement
- Short Positions: Based on premium risk measurement
- Dynamic Adjustment: Changes with market conditions
Risk-Reward Ratios
Each level displays its R:R ratio considering:
- Entry point (fair value or current price)
- Target level
- Stop loss level
- Applied leverage
Recommended Risk Parameters
Conservative Trading
- Maximum 1-2% risk per trade
- Use 50% of recommended leverage
- Target R:R ratios above 2:1
- Focus on high-probability setups only
Moderate Trading
- Maximum 2-3% risk per trade
- Use 75% of recommended leverage
- Accept R:R ratios above 1.5:1
- Trade multiple setups with correlation awareness
Aggressive Trading
- Maximum 3-5% risk per trade
- Use up to 100% of recommended leverage
- Accept R:R ratios above 1:1
- Active management required
Alert System
Structure Alerts
- Fair Value Structure Bullish: When structure turns bullish
- Fair Value Structure Bearish: When structure turns bearish
Level Interaction Alerts
For each premium and discount level:
- Touch Alerts: When price reaches the level
- Cross Above: When price breaks above the level
- Cross Below: When price breaks below the level
Range Alerts
- Rising into FV: Price enters fair value range from below
- Falling into FV: Price enters fair value range from above
- Rising Above FV: Price breaks above fair value range
- Falling Below FV: Price breaks below fair value range
Setting Up Alerts
- Enable desired alert types in indicator settings
- Create TradingView alerts using the indicator
- Configure notification methods (email, SMS, app)
- Test alerts with historical data first
Customization Options
Color Schemes
- Fair Value Colors: Customize based on structure bias
- Premium/Discount Colors: Match your chart theme
- Dynamic Coloring: Automatically adjusts based on price position
Label Customization
- Text Transparency: Adjust readability
- Background Transparency: Control label prominence
- Size Options: From tiny to large based on chart size
- Position Options: Multiple screen positions available
Table Settings
- Position: 9 different screen positions
- Size: 4 size options for different screen resolutions
- Transparency: Adjust for chart readability
Best Practices
Chart Setup Recommendations
Screen Real Estate Management
- Use larger timeframes for cleaner appearance
- Minimize lower timeframe labels on smaller screens
- Position risk-reward table to avoid price action interference
Multi-Timeframe Analysis
- Keep one chart with higher timeframe focus
- Use secondary chart for lower timeframe entries
- Synchronize timeframe selection across charts
Trading Psychology Integration
Patience with Structure
- Wait for clear structure bias before trading
- Avoid trading during structure transition periods
- Respect the higher timeframe bias
Risk Management Discipline
- Never ignore the calculated risk percentages
- Use leverage recommendations as guidelines, not rules
- Adjust position sizes based on market conditions
Entry Timing
- Use lower timeframes for precise entries
- Wait for price to reach significant levels
- Confirm entries with additional confluence factors
Common Mistakes to Avoid
Over-Analysis
- Don't wait for perfect setups that may never come
- Focus on high-probability scenarios
- Accept that not every level will hold
Ignoring Structure Bias
- Don't fight the overall structure direction
- Adjust strategies when structure changes
- Respect multi-timeframe alignment
Poor Risk Management
- Never risk more than the indicator suggests
- Don't ignore stop loss levels
- Avoid emotional position sizing
Advanced Techniques
Structure Transition Trading
- Identify when structure is changing
- Position for new bias direction
- Use tight risk management during transitions
Level Confluence
- Look for multiple level alignments
- Combine with support/resistance
- Use volume analysis for confirmation
Seasonal and Market Hour Awareness
- Adjust for different market sessions
- Consider seasonal patterns in structure
- Account for economic calendar events
Conclusion
The Fundur - Trend Trader indicator represents a comprehensive approach to modern technical analysis, combining traditional pivot point methodology with advanced fair value structure analysis. By following the guidelines in this manual and adapting the settings to your trading style, you can harness the full power of this indicator for more informed and profitable trading decisions.
Remember that no indicator is perfect, and the Trend Trader should be used as part of a complete trading strategy that includes fundamental analysis, risk management, and proper psychology. Start with conservative settings and gradually increase sophistication as you become more familiar with the indicator's behavior in different market conditions.
For best results, practice with the indicator in demo accounts first, understand its behavior in various market conditions, and always prioritize risk management over profit potential.
🚀 NEW FEATURES
🔄 Range Squeeze Alerts
- Entry alerts when volatility compression begins
- Exit alerts when squeeze ends and breakouts start
- Perfect for timing volatility expansions
📐 Advanced Fibonacci Levels
- Choose Standard (P1-P3, D1-D3) or Fibonacci modes
- Precision targets: P21%, P34%, P55%, P89%, P144%
- 55% Fair Value calculation for improved accuracy
- Extended targets for extreme market conditions
🔔 Smart Alert System
- Combine multiple alerts to reduce notification spam
- Individual or grouped alert options
- Cleaner, organized alert messages
🎯 MAJOR IMPROVEMENTS
📚 Comprehensive Tooltips
- 50+ detailed explanations for every setting
- Educational guidance and best practices
- Learn market structure while trading
⚡ Simplified Interface
- Streamlined settings, removed complexity
- Classic label styling for professional appearance
- Better organization and logical grouping
🔧 Technical Enhancements
- Optimized performance within TradingView limits
- Smart level display based on price position
- Enhanced visual system with cleaner charts
- Improved risk-reward calculations
📈 TRADING BENEFITS
- 🎪 Volatility Management - Never miss squeeze breakouts
- 🎯 Advanced Targeting - Fibonacci precision levels
- 🧠 Better Decisions - Educational tooltips guide optimal use
- 🔔 Smart Notifications - Flexible alert system
🏆 WHY UPDATE?
For Beginners: Tooltips make complex concepts accessible
For Pros: Advanced Fibonacci levels and squeeze detection
For Everyone: Cleaner interface, better performance, smarter alerts
🚀 KEY HIGHLIGHTS
- 🔄 Range squeeze entry/exit detection
- 📐 P21%-P144% Fibonacci targeting
- 📚 Educational tooltips for every setting
- 🔔 Combined alert system
- ⚡ Simplified, professional interface
- 🎯 Multi-timeframe precision analysis
This update transforms Trend Trader 2.0 into a complete educational trading system with advanced features, better usability, and smart automation.
Happy Trading! 📈
Risk Warning: Trading involves substantial risk. Practice proper risk management.
Script su invito
Solo gli utenti approvati dall'autore possono accedere a questo script. È necessario richiedere e ottenere l'autorizzazione per utilizzarlo. Tale autorizzazione viene solitamente concessa dopo il pagamento. Per ulteriori dettagli, seguire le istruzioni dell'autore riportate di seguito o contattare direttamente Fundur.
TradingView NON consiglia di acquistare o utilizzare uno script a meno che non si abbia piena fiducia nel suo autore e se ne comprenda il funzionamento. È inoltre possibile trovare alternative gratuite e open source nei nostri script della community.
Istruzioni dell'autore
Declinazione di responsabilità
Script su invito
Solo gli utenti approvati dall'autore possono accedere a questo script. È necessario richiedere e ottenere l'autorizzazione per utilizzarlo. Tale autorizzazione viene solitamente concessa dopo il pagamento. Per ulteriori dettagli, seguire le istruzioni dell'autore riportate di seguito o contattare direttamente Fundur.
TradingView NON consiglia di acquistare o utilizzare uno script a meno che non si abbia piena fiducia nel suo autore e se ne comprenda il funzionamento. È inoltre possibile trovare alternative gratuite e open source nei nostri script della community.