OPEN-SOURCE SCRIPT
Quarterly Theory —Q1,Q2,Q3,Q4
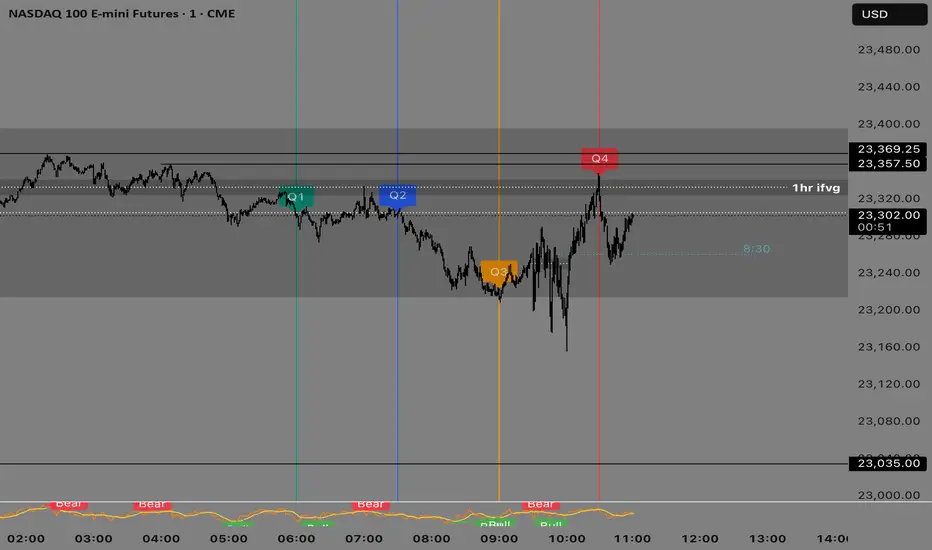
The Quarterly Theory Indicator is a trading tool designed to visualize the natural time-based cycles of the market, based on the principles of Quarterly Theory, popularized by the Inner Circle Trader (ICT). The indicator divides market sessions into four equal “quarters” to help traders identify potential accumulation, manipulation, and distribution phases (AMD model) and improve the timing of entries and exits.
Key Features:
Quarter Divisions (Q1–Q4):
Each market session (e.g., NY AM, London, Asia) is divided into four quarters.
Vertical lines mark the beginning of each quarter, making it easy to track session structure.
Optional labels show Q1, Q2, Q3, and Q4 directly on the chart.
True Open (Q2 Open):
The True Open is the opening price of Q2, considered a key reference point in Quarterly Theory.
A horizontal red line is drawn at the True Open price with a label showing the exact value.
This line helps traders filter bullish and bearish setups:
Buy below the True Open if the market is bullish.
Sell above the True Open if the market is bearish.
Session Awareness:
The indicator can automatically detect market sessions and reset lines and labels for each new session.
Ensures that only the current session’s True Open and quarter lines are displayed, reducing chart clutter.
Timeframe Flexibility:
Works on any chart timeframe (1-minute to daily).
Maintains accurate alignment of quarters and True Open regardless of the timeframe used.
Purpose of Quarterly Theory:
Quarterly Theory is based on the idea that market behavior is fractal and time-driven. By dividing sessions into four quarters, traders can anticipate potential market phases:
Q1: Initial price discovery and setup for the session.
Q2: Accumulation or manipulation phase, where the True Open is established.
Q3: Manipulation or Judas Swing phase designed to trap traders.
Q4: Distribution or trend continuation/reversal.
By visualizing these quarters and the True Open, traders can reduce ambiguity, identify high-probability setups, and improve their timing in line with the ICT AMD (Accumulation, Manipulation, Distribution) framework.
Script open-source
Nello spirito di TradingView, l'autore di questo script lo ha reso open source, in modo che i trader possano esaminarne e verificarne la funzionalità. Complimenti all'autore! Sebbene sia possibile utilizzarlo gratuitamente, ricordiamo che la ripubblicazione del codice è soggetta al nostro Regolamento.
Declinazione di responsabilità
Le informazioni e le pubblicazioni non sono intese come, e non costituiscono, consulenza o raccomandazioni finanziarie, di investimento, di trading o di altro tipo fornite o approvate da TradingView. Per ulteriori informazioni, consultare i Termini di utilizzo.