OPEN-SOURCE SCRIPT
Aggiornato Relative Strength NSE:Nifty for TF Community
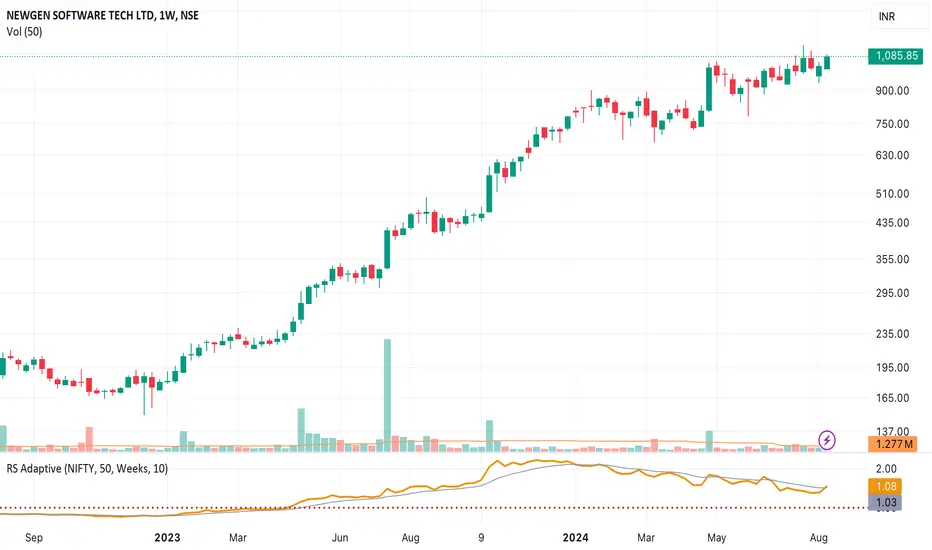
This is a modified version of the Relative Strength Indicator (No confusion with RSI) originally by in.tradingview.com/u/modhelius/ based on in.tradingview.com/script/A4WyMCKM-Relative-Strength/. The indicator calculates the relative strength between a selected stock and a comparative symbol (typically a market index like NSE:NIFTY).
Relative strength (RS) compares the performance of two assets, typically a stock and a market index, by dividing their percentage changes over a specific period. This indicator oscillates around zero:
- Greater than 0: Indicates the stock has outperformed the comparative symbol.
- Less than 0: Indicates the stock has underperformed the comparative symbol.
Key Enhancements:
This Relative Strength Indicator offers practical features to automatically adjusts the comparison period based on the chart’s timeframe, whether daily, weekly, or monthly, so you don’t have to make manual changes.
Secondly, if the selected stock has fewer bars than the comparison period, the indicator uses the shorter period to ensure accurate results. The default colors are hardcoded so they look fine for both dark and white themes, but of course can be changed.
You can customise the settings to fit your needs. The default period is set to 50/52, and the comparative symbol is NSE:NIFTY, but both can be changed. There’s also an option to toggle a moving average on or off, providing a smoother visual representation.
Note di rilascio
Change the SMA to EMA as per TF Community recommendation - Exponential MA is better than Simple MA. Note di rilascio
Chart changed to simple one. Script open-source
Nello spirito di TradingView, l'autore di questo script lo ha reso open source, in modo che i trader possano esaminarne e verificarne la funzionalità. Complimenti all'autore! Sebbene sia possibile utilizzarlo gratuitamente, ricordiamo che la ripubblicazione del codice è soggetta al nostro Regolamento.
Declinazione di responsabilità
Le informazioni e le pubblicazioni non sono intese come, e non costituiscono, consulenza o raccomandazioni finanziarie, di investimento, di trading o di altro tipo fornite o approvate da TradingView. Per ulteriori informazioni, consultare i Termini di utilizzo.
Script open-source
Nello spirito di TradingView, l'autore di questo script lo ha reso open source, in modo che i trader possano esaminarne e verificarne la funzionalità. Complimenti all'autore! Sebbene sia possibile utilizzarlo gratuitamente, ricordiamo che la ripubblicazione del codice è soggetta al nostro Regolamento.
Declinazione di responsabilità
Le informazioni e le pubblicazioni non sono intese come, e non costituiscono, consulenza o raccomandazioni finanziarie, di investimento, di trading o di altro tipo fornite o approvate da TradingView. Per ulteriori informazioni, consultare i Termini di utilizzo.