OPEN-SOURCE SCRIPT
True High/Low RSI for Divergence
This Pine Script creates a highly specialized RSI (Relative Strength Index) indicator designed to provide a more accurate signal for divergence trading. Its official title is "True High/Low RSI for Divergence."
Here is a breakdown of its core features:
1. Dual RSI Calculation based on Highs and Lows:
Unlike a standard RSI that typically uses the closing price of a candle, this indicator calculates two separate RSI lines:
A "High RSI": This line calculates the RSI based on the high price of each candle. It is intended to track momentum peaks more accurately.
A "Low RSI": This line calculates the RSI based on the low price of each candle. It is designed to track momentum troughs more accurately.
The main purpose of this separation is to avoid the potential errors that can occur when using an average price (like the close or hl2) during periods of high volatility. By using the true extremes of the price candles, the indicator aims to show a more "true" representation of momentum for identifying divergences between price and the indicator.
2. Dynamic Transparency:
This is a key visual feature. The RSI lines are not always fully visible. They dynamically fade into view as they enter significant overbought or oversold zones:
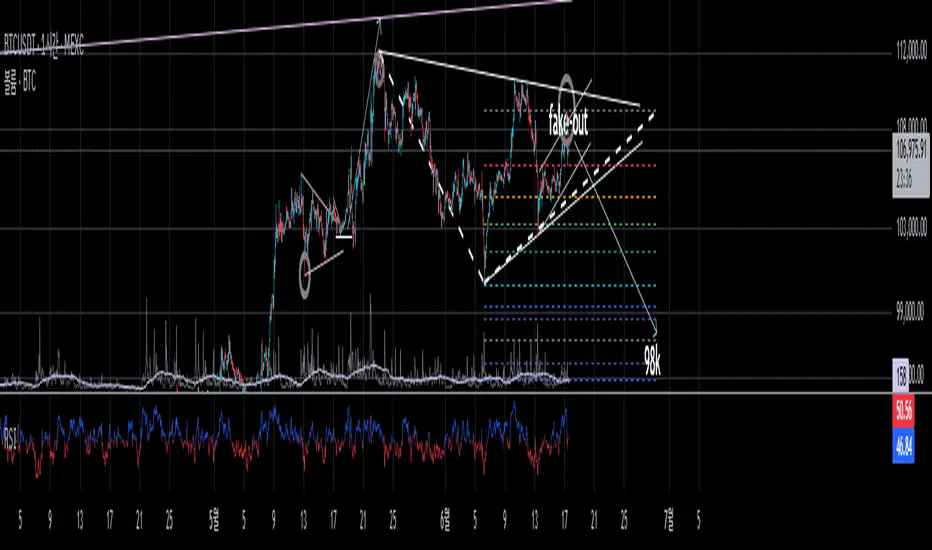
The Low RSI line (red by default) is invisible when above a value of 50. As it drops from 49 towards 30, it becomes progressively more opaque (more visible). It reaches full opacity at an RSI value of 30, visually alerting the user to strengthening oversold conditions.
The High RSI line (blue by default) is invisible when below a value of 50. As it rises from 51 towards 70, it also becomes progressively more opaque. It is fully opaque at an RSI value of 70, highlighting strengthening overbought conditions.
3. User Customization:
The script allows for user flexibility. You can change:
The colors for both the High and Low RSI lines.
The RSI calculation length (default is 14).
The price source for each RSI line (though they are specifically designed to use high and low).
In summary, this indicator is a purpose-built tool for traders who rely on divergence. It provides a more precise and visually intuitive way to track momentum at its true peaks and troughs, helping to make more informed trading decisions.
Here is a breakdown of its core features:
1. Dual RSI Calculation based on Highs and Lows:
Unlike a standard RSI that typically uses the closing price of a candle, this indicator calculates two separate RSI lines:
A "High RSI": This line calculates the RSI based on the high price of each candle. It is intended to track momentum peaks more accurately.
A "Low RSI": This line calculates the RSI based on the low price of each candle. It is designed to track momentum troughs more accurately.
The main purpose of this separation is to avoid the potential errors that can occur when using an average price (like the close or hl2) during periods of high volatility. By using the true extremes of the price candles, the indicator aims to show a more "true" representation of momentum for identifying divergences between price and the indicator.
2. Dynamic Transparency:
This is a key visual feature. The RSI lines are not always fully visible. They dynamically fade into view as they enter significant overbought or oversold zones:
The Low RSI line (red by default) is invisible when above a value of 50. As it drops from 49 towards 30, it becomes progressively more opaque (more visible). It reaches full opacity at an RSI value of 30, visually alerting the user to strengthening oversold conditions.
The High RSI line (blue by default) is invisible when below a value of 50. As it rises from 51 towards 70, it also becomes progressively more opaque. It is fully opaque at an RSI value of 70, highlighting strengthening overbought conditions.
3. User Customization:
The script allows for user flexibility. You can change:
The colors for both the High and Low RSI lines.
The RSI calculation length (default is 14).
The price source for each RSI line (though they are specifically designed to use high and low).
In summary, this indicator is a purpose-built tool for traders who rely on divergence. It provides a more precise and visually intuitive way to track momentum at its true peaks and troughs, helping to make more informed trading decisions.
Script open-source
Nello spirito di TradingView, l'autore di questo script lo ha reso open source, in modo che i trader possano esaminarne e verificarne la funzionalità. Complimenti all'autore! Sebbene sia possibile utilizzarlo gratuitamente, ricordiamo che la ripubblicazione del codice è soggetta al nostro Regolamento.
Declinazione di responsabilità
Le informazioni e le pubblicazioni non sono intese come, e non costituiscono, consulenza o raccomandazioni finanziarie, di investimento, di trading o di altro tipo fornite o approvate da TradingView. Per ulteriori informazioni, consultare i Termini di utilizzo.