OPEN-SOURCE SCRIPT
Fisher Transform on RSI

Overview
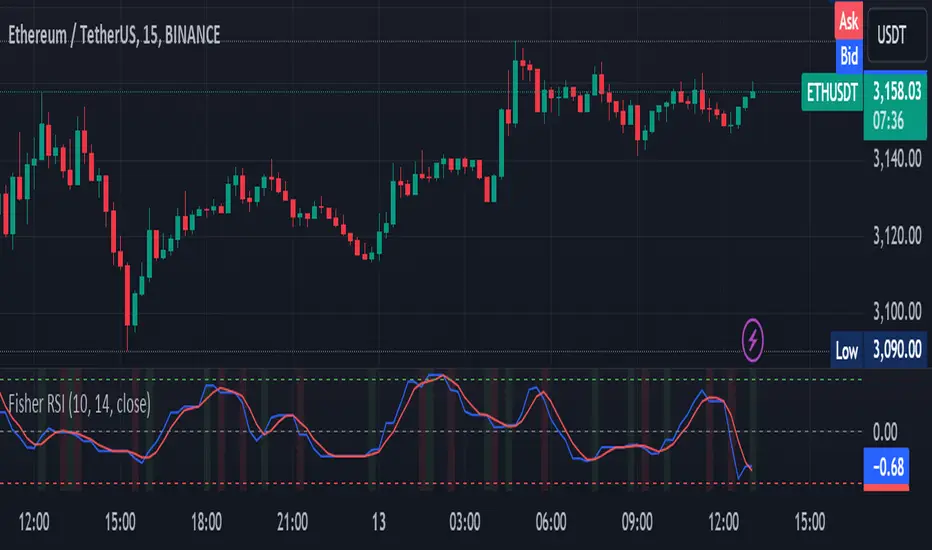
The Fisher Transform on RSI indicator combines the Relative Strength Index (RSI) with the Fisher Transform to offer a refined tool for identifying market turning points and trends. By applying the Fisher Transform to the RSI, this indicator converts RSI values into a Gaussian normal distribution, enhancing the precision of detecting overbought and oversold conditions. This method provides a clearer and more accurate identification of potential market reversals than the standard RSI.
Key/Unique Features
How It Works
Usage Instructions
The Fisher Transform on RSI indicator combines the Relative Strength Index (RSI) with the Fisher Transform to offer a refined tool for identifying market turning points and trends. By applying the Fisher Transform to the RSI, this indicator converts RSI values into a Gaussian normal distribution, enhancing the precision of detecting overbought and oversold conditions. This method provides a clearer and more accurate identification of potential market reversals than the standard RSI.
Key/Unique Features
- Fisher Transform Applied to RSI: Transforms RSI values into a Gaussian normal distribution, improving the detection of overbought and oversold conditions.
- Smoothing: Applies additional smoothing to the Fisher Transform, reducing noise and providing clearer signals.
- Signal Line: Includes a signal line to identify crossover points, indicating potential buy or sell signals.
- Custom Alerts: Built-in alert conditions for bullish and bearish crossovers, keeping traders informed of significant market movements.
- Visual Enhancements: Background color changes based on crossover conditions, offering immediate visual cues for potential trading opportunities.
How It Works
- RSI Calculation: The indicator calculates the Relative Strength Index (RSI) based on the selected source and period length.
- Normalization: The RSI values are normalized to fit within a range of -1 to 1, which is essential for the Fisher Transform.
- Fisher Transform: The normalized RSI values undergo the Fisher Transform, converting them into a Gaussian normal distribution.
- Smoothing: The transformed values are smoothed using a simple moving average to reduce noise and provide more reliable signals.
- Signal Line: A signal line, which is a simple moving average of the smoothed Fisher Transform, is plotted to identify crossover points.
- Alerts and Visuals: Custom alert conditions are set for bullish and bearish crossovers, and the background color changes to indicate these conditions.
Usage Instructions
- Trend Identification: Use the Fisher Transform on RSI to identify overbought and oversold conditions with enhanced precision, aiding in spotting potential trend reversals.
- Trade Signals: Monitor the crossovers between the smoothed Fisher Transform and the signal line. A bullish crossover suggests a potential buying opportunity, while a bearish crossover indicates a potential selling opportunity.
- Alerts: Set custom alerts based on the built-in conditions to receive notifications when important crossover events occur, ensuring you never miss a trading opportunity.
- Visual Cues: Utilize the background color changes to quickly identify bullish (green) and bearish (red) conditions, providing immediate visual feedback on market sentiment.
- Complementary Analysis: Combine this indicator with other technical analysis tools and indicators to enhance your overall trading strategy and make more informed decisions.
Script open-source
Nello spirito di TradingView, l'autore di questo script lo ha reso open source, in modo che i trader possano esaminarne e verificarne la funzionalità. Complimenti all'autore! Sebbene sia possibile utilizzarlo gratuitamente, ricordiamo che la ripubblicazione del codice è soggetta al nostro Regolamento.
Declinazione di responsabilità
Le informazioni e le pubblicazioni non sono intese come, e non costituiscono, consulenza o raccomandazioni finanziarie, di investimento, di trading o di altro tipo fornite o approvate da TradingView. Per ulteriori informazioni, consultare i Termini di utilizzo.