OPEN-SOURCE SCRIPT
MACD - STOCH - RSI
This indicator combines the
- MACD w/ Volume Conditions
- STOCHASTIC
- RSI
All into one place, to help find confluences between popular convergence / divergence indicators.
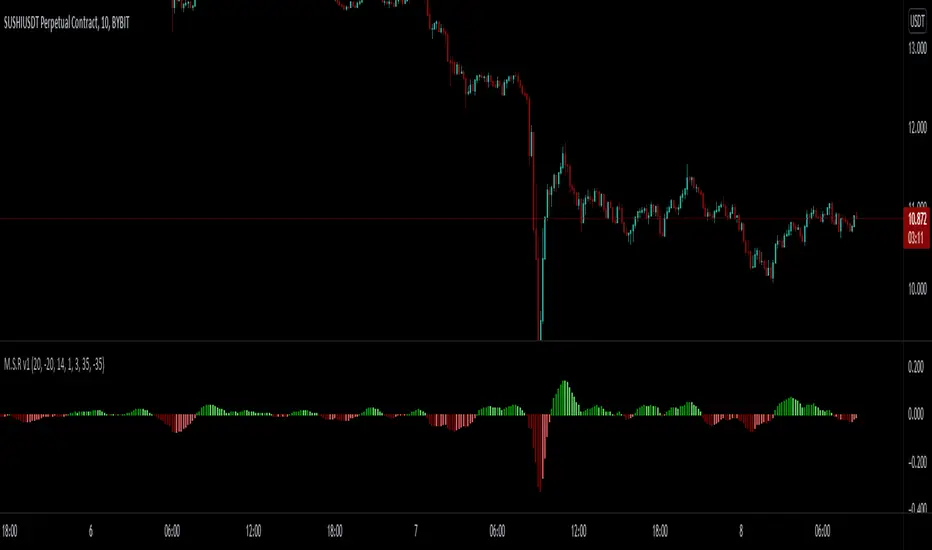
It's primary use is the histogram of the MACD.
The colors change whether or not the current bar is higher or lower than the previous.
Lighter shade signifies the bars are getting smaller.

You can also enable a feature which will change the color of the histogram depending on the volume.
There are 2 conditions which can be met which signify 'Increasing Volume' and 'Above Average Volume'.
If the MACD is above 0,
Light Blue signifies increasing volume.
Dark Blue signifies above average volume
If the MACD is below 0,
Light Purple signifies increasing volume.
Dark Purple signifies above average volume.
Having volume conditions within the histogram are meant to act as confluence. For example, if the histogram is
rising and light blue or dark blue bars are shown, this could hint towards a larger move to the upside if previous
upswings on the histogram were only green.
Increased volume near the peak of a move can also signify lots of orders coming into the market in hopes
of reversing the current trend or starting a correction.

formula:
Avg of volume over past 10 bars * 1.5 = increasing volume
Avg of volume over past 10 bars * 2 = Above Average Volume
--
The RSI and STOCHASTIC have been run through a custom function which moves the values. The middle line is now 0.
Where on most RSI and STOCHASTIC indicators the middle line can be considered 50, with overbought levels nearing 70
and oversold levels around 30.
On the M.S.R , the RSI overbought levels are by default 20, and oversold -20.
I've done this because for myself it was easier to understand RSI was becoming oversold if it went below 0, not 50.

The same function also applies to the STOCHASTIC indicator.

The RSI and STOCHASTIC can also be displayed together to help see the conditions of both indicators at once.

--
- MACD w/ Volume Conditions
- STOCHASTIC
- RSI
All into one place, to help find confluences between popular convergence / divergence indicators.
It's primary use is the histogram of the MACD.
The colors change whether or not the current bar is higher or lower than the previous.
Lighter shade signifies the bars are getting smaller.
You can also enable a feature which will change the color of the histogram depending on the volume.
There are 2 conditions which can be met which signify 'Increasing Volume' and 'Above Average Volume'.
If the MACD is above 0,
Light Blue signifies increasing volume.
Dark Blue signifies above average volume
If the MACD is below 0,
Light Purple signifies increasing volume.
Dark Purple signifies above average volume.
Having volume conditions within the histogram are meant to act as confluence. For example, if the histogram is
rising and light blue or dark blue bars are shown, this could hint towards a larger move to the upside if previous
upswings on the histogram were only green.
Increased volume near the peak of a move can also signify lots of orders coming into the market in hopes
of reversing the current trend or starting a correction.
formula:
Avg of volume over past 10 bars * 1.5 = increasing volume
Avg of volume over past 10 bars * 2 = Above Average Volume
--
The RSI and STOCHASTIC have been run through a custom function which moves the values. The middle line is now 0.
Where on most RSI and STOCHASTIC indicators the middle line can be considered 50, with overbought levels nearing 70
and oversold levels around 30.
On the M.S.R , the RSI overbought levels are by default 20, and oversold -20.
I've done this because for myself it was easier to understand RSI was becoming oversold if it went below 0, not 50.
The same function also applies to the STOCHASTIC indicator.
The RSI and STOCHASTIC can also be displayed together to help see the conditions of both indicators at once.
--
Script open-source
Nello spirito di TradingView, l'autore di questo script lo ha reso open source, in modo che i trader possano esaminarne e verificarne la funzionalità. Complimenti all'autore! Sebbene sia possibile utilizzarlo gratuitamente, ricordiamo che la ripubblicazione del codice è soggetta al nostro Regolamento.
Declinazione di responsabilità
Le informazioni e le pubblicazioni non sono intese come, e non costituiscono, consulenza o raccomandazioni finanziarie, di investimento, di trading o di altro tipo fornite o approvate da TradingView. Per ulteriori informazioni, consultare i Termini di utilizzo.