OPEN-SOURCE SCRIPT
Aggiornato Pickledeggtradermans RSI MA
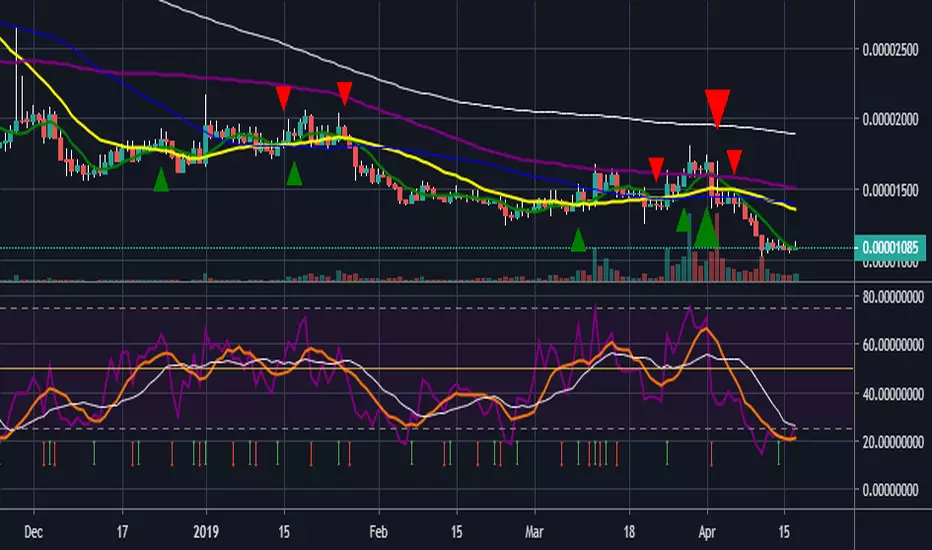
Hey guys just published another script that allows you to plot 3 sma's onto the RSI chart. Firstly the RSI close input is set to 7. the first sma is set at one in purple which is the current RSI level. Second MA is set at 7 and in orange, third and fourth ma's set to 14 and 21 in white and green respectively. Overbought/Oversold levels set at 75/25 with a midline at 50. These can all be tweaked to your liking. Enjoy
Note di rilascio
added an arrow indicator that shows when the rsi 7ma crosses over the rsi 1ma. Although this seems to slightly lag the cross i will be working to update the script to publish the arrows as soon as the cross happens when i get a little time to figure it out. EnjoyScript open-source
Nello spirito di TradingView, l'autore di questo script lo ha reso open source, in modo che i trader possano esaminarne e verificarne la funzionalità. Complimenti all'autore! Sebbene sia possibile utilizzarlo gratuitamente, ricordiamo che la ripubblicazione del codice è soggetta al nostro Regolamento.
Declinazione di responsabilità
Le informazioni e le pubblicazioni non sono intese come, e non costituiscono, consulenza o raccomandazioni finanziarie, di investimento, di trading o di altro tipo fornite o approvate da TradingView. Per ulteriori informazioni, consultare i Termini di utilizzo.
Script open-source
Nello spirito di TradingView, l'autore di questo script lo ha reso open source, in modo che i trader possano esaminarne e verificarne la funzionalità. Complimenti all'autore! Sebbene sia possibile utilizzarlo gratuitamente, ricordiamo che la ripubblicazione del codice è soggetta al nostro Regolamento.
Declinazione di responsabilità
Le informazioni e le pubblicazioni non sono intese come, e non costituiscono, consulenza o raccomandazioni finanziarie, di investimento, di trading o di altro tipo fornite o approvate da TradingView. Per ulteriori informazioni, consultare i Termini di utilizzo.